Monday, November 30, 2015

November: Average Temperatures But Below Average Precipitation

November is almost in the record books and it looks like we're going to be pretty close to average for temperature and below average for precipitation.

At the Salt Lake City airport, the trough-a-week pattern dominated the month, yielding fairly typical late fall ups and downs in temperature.  The last trough decided to hang around for a few extra days, yielding our current cold stretch.

Source: NWS
With one day left to go (today), the average temperature for the month is 40.15ºF compared to a long-term average (1981–2010) of 40.0ºF.  We'll probably end up just a hair below that long-term average after today is factored in.

For precipitation, the airport received 0.40", well below the average of 1.45".  Overall it was a decent month for artificial snowmaking, but Mother Nature had her struggles.  The thin natural snowpack is now quite weak and will be a prime concern for backcountry travel if it ever starts to snow again.

Sunday, November 29, 2015

Avenues Skiing and Medium-Range Prospects

Ah, freshies were had in the Avenues Foothills.  Not today, but five years ago today.  I just wanted to share that memory as that was the start of the epic 2010–11 ski season that we all remember so well.


The 2015-16 ski season is getting off to a slower start.  SNOTEL stations in the central Wasatch sit at 60–71% of average.  Average this time of year is not huge, so we're basically one good storm short of average.  If only we could get that one good storm!

Unfortunately the pickings are pretty slim in the medium-range forecasts.  The European ensemble shows very little outside of some snow showers today and tonight through at least December 4th.  Similarly, the North American Ensemble Forecast System (NAEFS) plume for Alta-Collins produces some snow showers through tonight, followed by a flat line until December 4th.  At that point, a few of the ensemble members bring a storm in, but others keep us mainly dry.
Thus, the upcoming work week looks like a good one for putting in some longer hours.

Saturday, November 28, 2015

Sometimes It Doesn't Take Much

There is not always a direct relationship between the amount of new snow and road-weather impacts.  Sometimes a little is enough to create problems.

The snow that fell late last night didn't come fast and furious.  It started at the Salt Lake City airport at around 4:50 AM MST and has added up to a whopping .03" of water equivalent through 8:40 am this morning.  That's probably pretty close to what I got in the Avenues foothills.


However, after the cold weather the past couple of days, the road surfaces are cold and the snow is sticking.  In addition, I suspect the road crews were caught off guard and nothing was plowed when I woke up this morning in my neighborhood.  Further, Commuterlink at 8:48 AM MST showed fairly slow going for a Saturday along much of I-15 and I-215 through the Salt Lake Valley.

Source: UDOT
Traffic cameras showed the light snow covering all but the busier lanes.

Source: UDOT
An inch at Alta so far.  It's not much, but I'm starting to learn to appreciate anything we get.

Friday, November 27, 2015

Black Friday

Black Friday is here.  Despite the thin snowpack, I'm going skiing.  I don't recommend shopping, but if you must, my book Secrets of the Greatest Snow on Earth makes a great gift.


The first print run is almost sold out.  A second is in process, but if you have to have it for the holidays, get it now to be sure.  Options are direct from University Press of Colorado, Amazon, Barnes and Noble, and great local bookstores like King's English at 15th and 15th, Weller Book Works in Trolley Square, and Dolly's on Main Street in Park City.  If you by direct from University Press of Colorado, enter 50for50 at checkout for 50% off.

Thursday, November 26, 2015

Thank You Mother Nature

Although I'd rather talk about snow, Mother Nature just keeps giving interesting weather and I experienced the full force of it on my pre-Turkey hike this morning.

While hiking in the Avenues Foothills, I experienced increasingly strong, cold easterly flow as I hiked eastward and upward to the top of the Avenues Twin.  It was absolutely frigid on top, with screaming easterlies of perhaps 25–30 mph.  I wasn't dressed for that!

Observations from the University of Utah show the development of the easterlies this morning with gusts reaching about 40 mph around 11 am.

Source: MesoWest
As is often the case, there was a well developed "Sandy Eddy" with the easterly flow turning cyclonically (counterclockwise) and becoming northwesterly or westerly flow over the Salt Lake Valley and upslope flow over the Wasatch Range near the Cottonwood Canyons.

Source: MesoWest
The Sandy Eddy has a very apparent signature when viewed from the Avenues foothills.  There is typically very clear air in the easterly flow over the northern Salt Lake Valley, but haze where the flow is northwesterly or westerly and impinging on the Wasatch.  I'm not sure if the haze reflects pollution, higher relative humidity in the upslope flow (which leads to the formation of haze particles), or some combination of those two factors.  Today there were also some small cumulus forming in that area.  


As I looked westward toward the airport, I also saw evidence of a pronounced hydraulic jump where the flow separates from the surface and rises rapidly.  An example of such a jump is provided by the figure below, which is based on an idealized numerical simulation.

Source: Doyle and Durran (2007)
Sometimes there is an opposing return flow downstream of the jump and that was indeed the case today as if you look at the MesoWest plot above the flow at the airport was northwesterly even as the winds were cranking out of the east at the University of Utah.

Cumulus clouds just near downtown provided evidence of the strong ascent associated with the hydraulic jump this morning.


This cumulus cloud and scd clouds extended northward just west of the Wasatch foothills (photo below taken ~15 min earlier than the one above).


Happy Thanksgiving!

Wednesday, November 25, 2015

This Storm Could Be a Turkey

Ah, it's a beautiful morning in Salt Lake.  The sun is shining.  Temperatures are around 50ºF.  Gorgeous.

The loop below shows very nicely the situation that has proven to be the bane of forecasters for so long.  As mentioned in earlier posts on this event, we have a situation of large-scale Rossby-wave breaking, with the upper-level trough forming rapidly over the Pacific States overnight last night.


All the action right now is to our north and west, although it's less impressive than I hoped it would be prior to moving into the Wasatch Front (thinking from a skier's perspective here, not a commuter's).  Each successive model run slows the system down a bit more and that continued to be the case through this morning.  Here's yesterday's NAM time-height for Salt Lake City showing frontal passage around 2100 UTC (2 PM MST) this afternoon, as well as a slug moisture in the pre-frontal southerly flow for this morning and the early afternoon.

Now here's today's.  Frontal passage is after 0000 UTC (5 PM MST) and the prefrontal environment is much drier.

Snow will eventually kick in later this afternoon over the mountains, but totals by tomorrow morning are going to perhaps only be in the 3-6 inch range in the upper Cottonwoods.  I haven't been putting any numbers on this event over the past few days as it seemed so hopelessly unpredictable, as we have discussed at length in early posts, so there's always the hope that I'm overly pessimistic, but I doubt it.  Right now, I think we'll escape the evening rush hour along the Wasatch Front without major weather problems, but keep an eye on things just in case.

Tuesday, November 24, 2015

How Much Should You Trust High Resolution Models?

The forecast for tomorrow morning provides a good example of one of the problems we have as meteorologists using higher resolution models.

For the 3-hour period ending at 1800 UTC (1100 MST) tomorrow, the NAM is generating just a bit of light precipitation over the northern Wasatch.


In contrast, the high-resolution 4-km NAM goes for considerably more precipitation, amounting to 0.16" of water in three hours at Alta-Collins.  Those aren't huge numbers, but they add up.


I'm seeing similar behavior in the NCAR ensemble for tomorrow.  The largest precipitation rates are being produced in the southerly flow ahead of the front at Alta-Collins.

High resolution forecasts like these are alluring as we know the central Wasatch can have strong effects on precipitation.  The problem, however, is that these models produce heavy mountain precipitation far more frequently than Mother Nature does, so the issue in a situation like this is how much to believe such a forecast?  If you bite on a forecast like this every time, you're going to have a lot of false alarms, and nothing annoys a forecast consumer more than false alarms.  Hitting a home run every now and then, but striking out frequently is not a path to success in the forecast business.

It will be interesting to see how things verify tomorrow.  Odds are that the precipitation rates being advertised for the central Wasatch by the high-resolution models are too high during the morning.

In the afternoon and evening, the front is expected to traverse northern Utah and bring snow to all elevations.  Although accumulations will probably be in the 1-4" range at most valley and bench locations, keep an eye on the forecast and adjust travel plans as needed as the currently advertised timing couldn't be worse.

Monday, November 23, 2015

Shades of Predictability

Predictability describes the extent to which the weather or an aspect of the weather can be predicted with existing tools and knowledge.  Its close partner is uncertainty, a measure of the ambiguity or lack of precision in a forecast. In any given forecast, some aspects can be relatively predictable, while  others are less predictable.  A good example is the forecast for this Thanksgiving week.

Over the next few days, a Rossby wave breaking event will occur over the north Pacific and western North America, as can be seen in the GFS dynamic tropopause (jet-stream level) loop below.  The wave breaking features the amplification of the high-amplitude ridge over the Gulf of Alaska and northwest North America and the near simultaneous amplification of the upper level trough over the western United States.


There is very strong agreement amongst the models and ensembles on this large-scale evolution.  Below are forecasts from several members of the Global Ensemble Forecast System (GEFS) valid Friday afternoon and they all show a large-scale ridge over western Canada and a trough over the western US.

Source: Penn State e-wall
Based on the correspondence between these models, the shift in the large-scale pattern over the western U.S. is relatively predictable with limited uncertainty.  It's going to happen.  

Precipitation, however, is another story.  There are differences in the strength and location of the trough and in turn the areas of precipitation pinwheeling around it, and these differences matter a lot for local accumulations.  If we look at our downscaled accumulated precipitation plumes from the North American Ensemble Forecast System (NAEFS), which includes the GEFS and ensembles from the Canadian model), we see huge spread in the forecasts for Alta-Collins.  Through 1200 UTC 27 Nov (Friday morning, when hoards of skiers will be looking for snow), accumulations range from as little as 0.1" of water equivalent to as much as 2.4".  This about as much spread as I've seen in these forecasts since we started producing them last year.  Usually, there is stronger clustering.  Thus, the precipitation predictability for any given location is low and the uncertainty high.


The meat of the precipitation plumes lie in the range from about 0.8" to 1.6" through Friday morning (most of that precipitation falls late Wednesday or Wednesday night).  If you need a most likely scenario, that's it.  If I had to pick a most likely side that an alternative result could fall on, it would be the low side (sorry, but regular readers of this column know that I'm a realistic pessimist and like to be surprised by more snow than I expected).  

The bottom line is if you are traveling Wednesday or Thursday, keep a close eye on the weather forecast and be prepared for the possibility of winter driving conditions.  

Sunday, November 22, 2015

The Trough a Week Club Continues to Deliver

We have been in quite a cycle the past month with a trough passing through northern Utah early in the work week each of the past four weeks.  Each trough is similar in that it brings a temperature drop, followed by a recovery.  Check out the temperature ranges below for each day in October and November.  After a long stretch of quiescent weather in October, we had a trough passage and associated temperature drop around Oct 29, Nov 4, Nov 10, and Nov 16.

Source: NWS
The trough of the week club will continue to deliver this week, bringing the warm before the storm through Tuesday,


and then a return to more winter-like temperatures on Wednesday.


As was the case with the previous storms, we're dealing with a crap shoot for what will happen for mountain and possibly valley snow.  Contrasts in the track, strength, and shape of the trough can make a big difference for precipitation around here, so I'm still taking a wait and see approach until we get a big closer to the event.  The uncertainty is reflected in the large spread being produced by our downscaled North American Ensemble Forecast System (NAEFS) guidance for Alta, which shows members producing from as little as about 0.4" of water to as much as 2.5".


It would be great to get the latter.  A once a week storm is better than nothing, but we remain on the shy of what I'll call "real" skiing and the stretches of warmer, sunnier weather are hell on the south facing aspects.  On the plus side, the regular storms keep the valley stirred up and the inversion at bay.

Friday, November 20, 2015

Locally Dense Snow and Globally High Temperatures

There are some numbers coming out of the high elevations of the central Wasatch that I really like.  How about 3 inches of snow with 0.6 inches of water at Alta-Collins through 7 am.  That's 20% water content, nasty by even Cascadian standards, but the sort of stuff we need to build up a base.  I'll take it gladly over cold smoke at this stage.

Less encouraging are the outrageously high global mean temperatures for October.  Talk about off the charts.  Thank you El Nino and global warming.
Source: NCEI
And for those keeping score at home for the year to date, it's still 2015 1, the rest of the instrumented record 0.

Source: NCEI
Two predictions for the future.  2015 will be the warmest year on record by a wide margin (an easy forecast).  When there is an inevitable temporary drop in global temperatures following this El Nino, such as occurred following the last Uber El Nino in 1997, you will hear people claiming a global warming hiatus once again.

Thursday, November 19, 2015

Funky Clouds, Tonight's Storm

There was a beautiful cloud display this morning as the altostratus covered the sky like a wavy blanket.  The morning sunrise tickled its soft white underbelly.


Here's another view later.  Pity my cell phone camera is such a piece of junk.


Clouds that cover the sky like a blanket and have large wave-like undulations are now called undulatus asperatus, the first cloud type to be officially recognized in many years.  I'm not sure if the amplitude of the waves this morning was sufficient for to qualify as that cloud type, but it was a pretty scene.

We are very close to having forecasts from the National Center for Atmospheric Research 3-km ensemble available on our web site.  It's based on the Weather Research and Forecast model and has 10 members.  We have no idea how well it will work, so I'm interested in seeing how it does over the next several storms, including tonights, which looks to be a windy, orographic affair with strong crest-level flow shifting from westerly to northwesterly overnight.

The plot below shows the 48-hour precipitation accumulation (water equivalent) produced by the ensemble from 0000 UTC (5 PM MST) yesterday afternoon through 0000 UTC (5 PM MST) Friday afternoon.  The ensemble mean, maximum, and minimum precipitation is along the top row, showing you the range of what the 10 members are producing, with the probability of .01, 1, and 2" on the bottom row.  The peak water equivalent in the central Wasatch varies from just over .4" of water equivalent to over an inch.
The plume for Alta-Collins shows significant variations in the timing and amount of precipitation.  The members that generate precipitation early are also the wettest (see the top panel) producing about 0.9 to 1.35 inches of water.  Those that generate precipitation late are relatively dry (see the red lines) and generate .4 to .6 inches of water.

The hourly precipitation graph at the bottom is something we cooked up based on the input of colleagues in the avalanche business who really want to know what periods have the greatest potential for heavy precipitation.  The red line represents the median or middle of the 10 ensemble members, the "box" captures the middle half of the members, and the blue lines extend to the lowest and highest member.  In this plot, you can see that the model produces the greatest odds of heavy precipitation from about 11–15 UTC (4–8 AM MST) tomorrow morning, although there's at least one member at each hour during that period that produces very little precipitation.

At this point we have very little clue concerning the performance of this modeling systems, including the biases in amounts and the spread of the ensemble.  High-resolution ensembles like this are, however, the future of weather forecasting, so I look forward to assessing the strengths and weaknesses of this ensemble during the coming winter.  

Wednesday, November 18, 2015

Will This Be Utah's Hottest Year on Record?

The hottest year on record in Utah remains 1934, a black-swan year if ever there was one.
Source: NCDC
However, we are making a run at it this year.  For the year-to-date through the end of October, 1934 and 2015 are in a near dead heat with statewide average temperatures of 54.8ºF and 54.9ºF, respectively.  
Source: NCDC
November and December 1934 brought temperatures that were 2.6ºF above average, so that's the number for November and December 2015 to aim for.  Lots can happen in November and December, so I'm not making any predictions.  I do suspect that unless we get really cold in December, something in the top 5 is virtually assured.

Tuesday, November 17, 2015

Pretty Average Start to the Snow Year

If I had my choice, I'd take a dry October followed by a really big storm cycle in November to kick off the ski season.  We had the former, but we've yet to really get walloped this November.  Instead, we've had three storms that collectively have given us about as close to a run-of-the-mill snowpack as we can have, and given what we dealt with last year, I ain't complaining.

Here's the latest from three SNOTEL sites in the central Wasatch (I skip Brighton, which I've always considered problematic).  Thaynes Canyon is running at 80% of median (median being the value that splits the upper and lower halves of past snowpacks), Mill-D North is right on median, and Snowbird is just a shade behind.  At Snowbird, the data does not include yesterday, however, which would probably push it pretty close to median.


Source: NRCS
What will the winter bring?  Jason Samenow posted a nice article on Capital Weather Gang yesterday discussing how El Nino is now in uncharted territory.  The departure from average temperature in the central Pacific is the highest recorded.  Projections from the NCEP Climate Forecast System are still producing an average solution calling for a wet southwest and a dry northwest interior.  An example of the average of a subset of those projections for Dec-Feb and Jan-Mar is below, but other subsets show a similar distribution.  Northern Utah, of course, is in the transition zone.
Source: NCEP
That doesn't mean we will have an average year, but simply that the dice aren't really loaded for us one way or the other, consistent with an analysis of past El Nino events.  If that doesn't do it for you, be sure to consult the Wasatch Weather Weenies survival guide to El Nino.

Monday, November 16, 2015

Impacts of Shallow Upslope?

We're currently post-frontal, but the depth of the northwesterly flow is quite shallow.  I'm not sure if this explains the radar distribution seen below, but there does appear to be enhancement on the west side of the Stansburys, Oquirrhs, and central Wasatch with more limited penetration into the high terrain.  The enhancement on the Oquirrhs also wraps around the NE side for reasons I can't explain.


On the other hand, the flow is weak and it's a complicated pattern, so other ideas welcomed.

When Stuff Comes From the East

Interesting radar loop this morning.  Note how the echoes are coming from the east across the central Wasatch.


The upper-level low has closed off sufficiently that the flow has an easterly component.  Nobody is happier than than those in the Park City area who are getting some of the white stuff this morning.

Source: UDOT
The overnight phase of the storm didn't exactly play fair.  Precipitation spread just far enough north for the southern and central Wasatch to do well, but the northern Wasatch largely got skunked.  An example radar image is below.  

Source: NCAR/Ral
Alta-Collins had an 8" storm total on the stake as of 8 am, from only .54" of water.  Upper portions of PCMR may have done a bit better.  The Thaynes Canyon SNOTEL has 0.6" of water through 8 am and an increase in total snow depth of 7" (typically that underestimates the new snow depth due to compaction of the underlying snow).  

A few hours of easterlies can do wonders for the Park City side.  As discussed in my book, under easterly flow there is a temporary shift in the windward side of the Wasatch from the Wasatch Front to the Wasatch Back.  

Source: Secrets of the Greatest Snow on Earth
Easterlies didn't prevail all last night, but they seem to have helped the last couple of hours.  

Sunday, November 15, 2015

Here We Go Again

To paraphrase The Who, "meet the new trough, same as the old trough."  Yes, we have another storm rolling in.  Yes, on the large scale, it is remarkably similar to the other storms we've had this month.

The loop below begins yesterday morning and goes through early morning on the 19th when the storm is exiting Utah.  We've seen this movie before.  An amplifying upper-level trough digs off the California coast and continues to strengthen as it moves inland.  Central and southern Utah and Colorado once again appear to be favored by the storm track.


How similar is the large scale in these events?  The loop below shows analyses of the previous two storms and the forecast for the one moving through the west this week.  Identical?  Nope, but quite similar.  


Thus, many characteristics of this storm will be similar to the previous two.  Today we will have the warm before the storm, with warm, windy conditions,  Then a transition to cooler temperatures tonight and early tomorrow morning, then the post-frontal crap shoot.

When it comes to mountain and valley snowfall, however, the devil is in the details.  A small change in the characteristics of the storm can make a big difference given the strong terrain forcing we have around here.  We've already seen some of the weirdness of the past two storms depending on small shifts on the storm track and accompanying precipitation features (how about that 7 inches in 3 hours at Alta-Collins last Tuesday).

Through 5 PM tomorrow, the NAM generates 0.41" of water and 6.7" of snow for Alta-Collins, whereas the GFS is going for 0.49" of water and 8.7" of snow.  Based on the characteristics of this storm, I would be inclined not to jack those up much and to go with something like 4-8" as the most likely range at Alta through 5 PM tomorrow, but would not be surprised if we did better.

Beyond that, you are on your own.  I'm going biking.

Saturday, November 14, 2015

And So It Begins...

The natural snowpack remains a bit thin for my backcountry interests, but we got out for our first day today, taking advantage of the man-made-enhanced snowpack in Collins Gulch.  Alta plans to open on Thursday, so kudos to them for keeping the mountain open for uphill skiing today.


My back has limited my ski adventuring the past couple of years, so days like this skiing with my son are priceless, even if the snow is scratchy instead of bottomless.


Of course, my tours always involve some snow science.  Since nothing was falling from the sky, we investigated the dreaded man-made crust.  Nasty stuff!


Hopefully it will be buried by the real stuff soon.

Friday, November 13, 2015

DIY Forecast Tools, Part II

This is a continuation of the previous post (DIY Forecast Tools, Part I) and examines some additional products available from the Utah Weather Center (http://weather.utah.edu) that are useful for DIY weather forecasting.

1. Time-Height Sections

To my knowledge, we are the only group providing access to model time-height sections.  I've always found this surprising because they are a wonderful tool for forecasting.

Most of the time-height sections on our site are produced with BUFR sounding data from either the NAM or GFS model.  BUFR sounding data pulled directly from each model at very high vertical resolution, enabling highly detailed time-height sections.

Time-height sections show the evolution of the atmosphere with time over point.  We plot ours so that time increases to the left.  This sounds strange, but it results in the winds appearing to curve cyclonically with a trough passage, which is easier to visualize if time increases to the right and they appear to curve anticyclonically.  The time heights we produce include wind barbs, relative humidity (color filled), and equivalent potential temperature (a.k.a. theta-e).  Equivalent potential temperature is a thermodynamic quantity based on both temperature and moisture that is very useful for identifying fronts (strong horizontal gradient or contrast), stable layers (strong vertical gradient or contrast), and areas of instability or potential instability (little change or a decrease in equivalent potential temperature with height).  We also plot the model freezing level and areas of potential instability on these plots.

The time-height below is from today's NAM and for Salt Lake City.  Note the arrival of the forecast front around 12Z on Monday and the wind shift and low-level moisture associated with it.  I find these plots to be extremely useful for examining flow direction changes with height, humidity (and inferred clouds) and their distribution, and the timing of fronts and related changes in stability.  In turn, I use this information to anticipate how the mountains will affect the weather.


2. Soundings

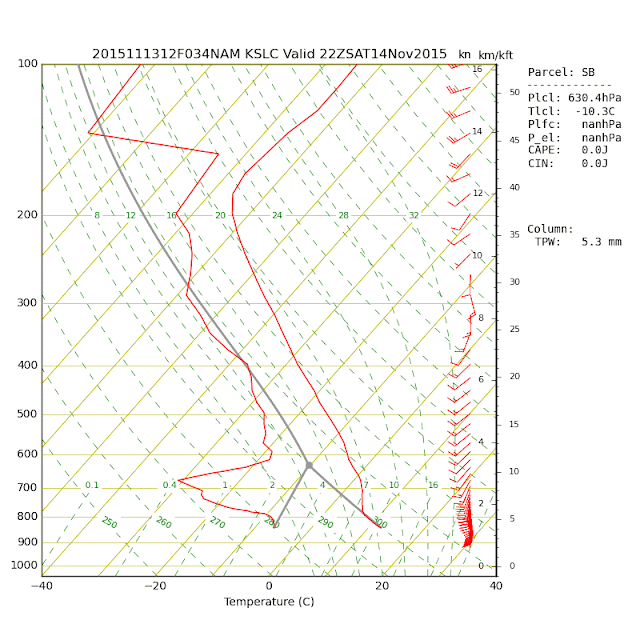
We also produce soundings with the BUFR data on a Skew T/log P diagram.  The Skew T is a special diagram with tremendous applications for forecasting.  I can't explain it in 1,000,000 words or less (I've tried), but if you sign up for an account, you can learn about it for free at the COMET Meted site.  The bottom line is that these soundings provide information about the distribution of wind, temperature, humidity, and atmospheric stability that can be used for everything from the forecasting of thunderstorms to the evolution of the inversion.
3. Meteograms

These are time series of forecast weather conditions at specific points.  They are a mixture of direct model output and algorithm-derived products developed by my group.  Below is the NAM meteogram for Alta from today's run.


Keep in mind that in most instances, no attempt has been made to adjust these forecasts for local effects, which can have a strong influence on the weather.  They are meant to be used as guidance for a forecast, rather than as a forecast.

4. Little Cottonwood Canyons Guidance

Same as the meteograms, but in tabular format.  Click here to access.  Again, this is guidance, not a forecast.

5. Great Salt Lake-Effect Meteograms

Time series of several variables commonly used to forecast lake effect precipitation.  Includes direct model forecasts and some algorithm derived variables (e.g., Great Salt Lake Effect probability).  Again, this is guidance.


6. Great Salt Lake-Effect Guidance

Same as meteogram, but in tabular format.  Click here to access.

7. Summary

That was a lot of spaghetti to throw at the wall.  Try putting together a forecast for the Sunday Night/Monday storm and see what sticks!