Saturday, July 30, 2022

New GFS Soundings and Time Heights

Following up on the previous post (New HRRR Products on weather.utah.edu), I've now added new GFS model soundings and time-height sections as well.  They are under the GFS-0.25 deg tab.

The soundings are plotted on a thermodynamic diagram known as a "Skew-T," so called because a line of constant temperature is skewed 45˚ from the horizontal (grey lines that slope upward to the right below).  There is a wealth of information on these charts, but there's a summary available here. The diagram lines, described in greater depth at that link, include pressure (horizontal grey), dry adiabats (red dotted), moist adiabats (blue dotted), and mixing ratio (green).  The red and green lines are the model forecast temperature and dewpoint.  

The black line is the theoretical profile a parcel of air would have if it were lifted.  In this case, I am plotting the "most unstable" parcel.  That is, the parcel with the most Convective Available Potential Energy (CAPE).  Sometimes it is the surface parcel (as is the case in the plot above).  In others, it can be elevated.  Black dots show the level of the most unstable parcel and its lifting condensation level, which is the level at which the the parcel reaches saturation.  No black lines or dots are plotted if there is no parcel that has CAPE.  Maybe more on all this stuff in the future.

The time-height sections include relative humidity (color fill), the 0˚C isotherm, wind barbs, and vertical velocity (upward red, downward blue).  These are very useful for forecasting mountain precipitation and should be valuable this coming winter. 

There are a few additional changes to weather.utah.edu:
  1. I've eliminated the high-resolution nam nest.  It's never been very useful for wintertime precipitation forecasting due to a high bias, so I've elected to axe it so I have one less product to support.
  2. I've added HRRR forecasts out to 48 hours.  This is basically a better alternative to the NAM nest.  These forecasts are available every 6 hours, so there are now tabs for the 48- and 18-h HRRR runs (the latter available every hour).
  3. I've done some rearranging and naming of the products in the left-hand nav bar to make it simpler.
  4. The old LCC guidance product has been removed and only one LCC guidance product, based on the GFS, will be available moving forward.  
I know that the interface for weather.utah.edu is old and obtuse.  I can do some basic editing of it, but a wholesale upgrade is beyond my programming abilities.  It will remain as is until I can find someone to work on it.  

Tuesday, July 26, 2022

New HRRR products on weather.utah.edu

I've added some new HRRR products on weather.utah.edu.  In fact, I've completely upgraded our HRRR postprocessing suite over the past couple of weeks, migrating to python and building in a lot of capabilities that should improve reliability and produce far superior graphics than those that have been around now for 20 years.  In particular, the code uses Amazon Web Services as the primary access point for the data, with a fall back to the National Weather Service if there's a hiccup.  It will auto backfill if products are not produced (assuming our servers are up).  It's also parallelized and, for the three product types that are currently being produced, and download and process an 18-hour HRRR forecast in three and a half minutes.  The color schemes are also supposed to be more color-blind friendly.  

The three products that are available are composite reflectivity and IR, hourly precipitation, and total precipitation.  

On weather.utah.edu, you can loop through these.  Here's a direct link for the western US radar and satellite loop: https://weather.utah.edu/index.php?&t=hrrr&d=CR&r=WE.

There are also plots available for the Northwest, Southwest, Intermountain, Northern Utah, and Wasatch Front regions.  The total precipitation product includes annotated values for several locations including the gridpoint nearest to the Salt Lake City Airport, Cottonwood Heights, Alta-Collins, Canyons Daybreak, Snowbasin Middle Bowl, Ben Lomond Peak SNOTEL, Deer Valley Ontario, Sundance, Powder Mountain, Trial Lake SNOTEL, Tony Grove SNOTEL, and Bunnels Ridge observing sites.  There's nothing to see today (no precip), but this should be useful in the future.  

There's still a lot broken on weather.utah.edu, including time heights.  Many of the graphics are also dated. I will be doing updates from time to time as time permits.  Please be patient.  I only have a little time here and there to work on these things.  Alert me if you see bugs.

Sunday, July 24, 2022

A Warm Night

I thought I would beat the heat with an early morning ride of Flying Dog above Jeremy Ranch this morning.  The trailheads there are usually some of the cooler spots around, but cloud cover, humidity, and a bit of a breeze prevented much overnight cooling.  The site at the bottom of Woodward Park City, for example, dropped below 60˚F each of the previous four nights, but last night only got down to 65˚F.  Ick.

My car thermometer measured 73˚F at the trailhead at 7:45, which was probably close and wasn't much lower than the overnight minimum at the Salt Lake City airport (77˚F).  

Fortunately, the cloud cover masked the sun on the ride, so perhaps it was a reasonable tradeoff.  

Regardless, I'm so sick of this heat.  Based on the most recent 30-year climate "normals" (whatever that means anymore, the hottest days of the year at the Salt Lake City airport are from July 23-27 (Average high and low 96 and 70, respectively).  Call this climatological hump week, although climate is what you expect and weather is what you get. 

Friday, July 22, 2022

Visit to Storm Peak Lab

Storm Peak Lab is a permanent mountain-top research facility located at 3220 m (10,564 ft) near the summit of Steamboat Springs ski area.  The lab has been in existence for more than 40 years, with equipment initially operated from a small trailer and now as a permanent facility.  

Storm Peak Lab

This summer, ownership and operation of the lab transition from the Desert Research Institute to the University of Utah under the direction of Dr. Gannet Hallar, with significant support for the lab coming from the National Science Foundation and other agencies.  Earlier this week, I made my first visit to the lab with a group of undergraduates who are participating in our Research Experience in ALpine Meteorology program (REALM).

REALM students and other visiting scientists and students at Storm Peak Lab

There are remarkably few mountain-top or high-altitude scientific laboratories in the world that collect a comprehensive suite of meteorological, cloud, trace gas, and other observations.  The lab is quite literally packed with instruments, some permanent and some temporary.  These instruments measure a remarkable array of variables including trace-gas concentrations (e.g., carbon dioxide), cloud condensation nuclei, ice nuclei, etc. etc.  Such measurements are critical for understanding air pollution, cloud and precipitation processes, and climate change.  

Gannet Hallar describes the instruments at Storm Peak Lab

The students and I learned, for example, about mercury in the atmosphere, its natural and human sources, and how measurements at the lab are advancing our understanding of its sources and sinks.  

Dr. Lynne Gratz of Colorado College presents her latest work on mercury in the atmosphere

We're excited for Storm Peak Lab to be a University of Utah facility.  It will be a game changer for us, not only for mountain meteorology, but also interdisciplinary mountain studies, education, and outreach.  With support from the National Science Foundation, I am planning on taking a group of graduate students there in the fall as part of my graduate-level mountain meteorology course.  

Monday, July 18, 2022

Records Falling

Yesterday's high at the Salt Lake City International Airport of 107˚F set a record for the calendar day and tied the the all-time high temperature reached previously on 26 July 1960, 13 July 2002, and 15 June 2021.

Nearly all stations reporting to MesoWest at elevations below 5000 feet elevation in the Salt Lake Valley were at or above 100˚F.  Record highs for the calendar day were also set at the City Creek water plant (98˚F), BYU (104˚F), and Tooele (105˚F).  

I fielded a number of question yesterday about why the airport is so warm and whether or not the instrument is properly calibrated.  We have dealt with such questions many times since I started this blog over 10 years ago (for example, see What's Up @KSLC).  Only the National Weather Service can comment on the current calibration of the KSLC instrument.  I'll address here the representativeness (or lack thereof) of the airport observing location.  

Urban and near-urban areas exhibit large spatial variability in temperature.  There is no single representative site at which you can measure temperature in an urban area.  Temperatures will be different in Liberty Park than downtown.  One side of a building is going to have a different temperature than another.  Variations of a few degrees or more are not uncommon.  

Airport observations are representative of airports.  Airports do not have the same building or surface characteristics as downtown cores, suburban areas, highway corridors, or city parks.  

Based on the available observations, it is not unusual for KSLC to observe the highest temperature in the Salt Lake Valley on summer afternoons.  This is especially true when the flow is from the south (as it was yesterday) and the lake breeze and up-valley northwesterly flow that often develops during the day is suppressed.  

One reason for this is the airport is the lowest place in the valley.  Another is that the airport is in an area with limited tree cover and irrigation, especially since the closure of Wingpointe Golf Course.  

Additionally, the site of the National Weather Service station is likely vegetation free.  It was the last time I visited there and was when the satellite imagery used by MesoWest was collected.  Note the observing site below (temperature of 104˚F from yesterday) showing the station in the middle of a denuded field.  

Source: Mesowest

Trends at the airport have also been affected not only by global and regional climate change, but also urbanization along the Wasatch Front and nearby region, airport development, moves of the observing site, and instrumentation changes.  These issues have also come up frequently on this blog.  There is no location in the Salt Lake Valley that would not be affected by changes such as these (the airport development might be unique to that location, but everywhere in the Salt Lake Valley has experienced developmental change).  

So, an all-time record at the airport is just that.  An all-time record based on observations collected by the National Weather Service (or their predecessor the US Weather Bureau) at the airport (or prior to the late 1920s downtown Salt Lake City).

Meanwhile, across the pond, the UK Met Office is still expecting the all-time record high for the UK of 38.7˚C to fall today or tomorrow.  I just tried to pull up some observations from the UK Met Office Weather Observations Website and just got a spinning wheel.  There must be a lot of meteorologists checking out the latest readings ;-).  The UK Met Office has reported that it is likely already the hottest day on record in Wales.


Friday, July 15, 2022

Heat, Heat, and More Heat

I've never been a fan of July and sadly it is only getting worse.

Let's begin looking at the first two weeks of July at the Salt Lake City International Airport.  The average temperature was 87.1˚F, the hottest on record.  

Source: http://xmacis.rcc-acis.org/

A few more numbers.  The lowest maximum temperature so far this July was 96˚F on July 1st.  96!  Maximum temperatures have ranged from 96 to 104 and there have been 7 days at 100 or more.  If we add June, there have been 10 days at 100 or more so far this summer.

The lowest minimum temperature so far this July was 68˚F on July 11.  Minimum temperatures have ranged from 68 to (gulp) 81.  81!  In fact the average temperature on that day (July 3) was 90˚F, although that was beaten on July 9 when the average temperature reached 90.5˚F.  To date, there have only been 21 days in the historical record with an average temperature of 90˚F or more.  19 of these days have occurred in the 2000s (and the 90˚F on 16 July 1925 would have been a reading from downtown SLC).  

Source: http://xmacis.rcc-acis.org/

To state the obvious, we are living in a new urban climate regime in which July's are a hotter beast than they were in the 20th century, and the trend is not good.

Elsewhere, western Europe is bracing for a potentially historic heat wave.  The UK Met Office issued it's first-ever Red Warning for Exceptional Heat today.  I don't know how long that warning system has been in place, but the record high temperature in the UK is 38.7˚C (101.7˚F) and they currently pout the odds of beating that at 80% with a 50% chance of topping 40˚C (104˚F).  Other countries affected by the heat include France, with impacts on the Tour de France. 

In 50 years, I'll be dead, but I wonder what some future Wasatch Weather Weenie will be writing about the climate in 2072.  I suspect it won't be good.  

Wednesday, July 13, 2022

A Little Monsoon Moisture

This time of year, clouds are good.  It's hot, but without direct sun, the help cut the intensity of the heat.

Monday night, a little monsoonal moisture made it into northern Utah, increasing the cloud cover yesterday and producing a few showers and gusty winds.  Most of the precipitation evaporated, but I saw a few drops hit the ground.  

A look at the weather observations at the Salt Lake City International Airport shows the increasing moisture well.  The green line below is the dewpoint, which is a measure of the absolute water content of the atmosphere at the surface.  Values have climbed steadily over the past five days and are now just a bit over 50˚F.

The HRRR cloud and radar forecast for this afternoon shows convective storms developing over northern Utah.  


The HRRR can't reliably predict the location of convective storms, so where and when such storms develop is difficult to say, but expect some showers, thunderstorms, and gusty winds this afternoon.    

Sunday, July 10, 2022

Alta Ski Report

 I rose early this morning and hiked up Sunset Peak from Brighton.  As I sat on the summit, stared westward over Alta, Snowbird, and the Alpine Ridge and wondered if there was any skiable snow remaining. 


Shortly thereafter I got a text from my son saying he skied the main chute, so apparently there is.  He described it as "awesome, but really scary."  I don't really know how to interpret that, but I guess it still goes.  

I haven't seen pictures, but imagine the white ribbon of death that remains won't survive long.  I haven't had the courage to look at the models, but I took at peak at the NWS forecast for the airport and the highs are:

Monday 96
Tuesday 100
Wednesday 101
Thursday 100
Friday 99
Saturday 99
Sunday 99

The forecast low for tonight is, however, 69˚F.  We'll see if that verifies, but it will be the first sub-70 reading of the month if it does.  

Tuesday, July 5, 2022

Possible Record Low Great Salt Lake

The Great Salt Lake is expected to set a new historical low elevation at the Saltair Boat Harbor this year and provisional data from the USGS suggests it is pretty close to that level right now.

Below is yesterday's MODIS image from NASA's Aqua satellite showing the large area of exposed playa the northern and southern arms of the lake, including the former Farmington Bay immediately adjacent to Antelope Island and the Salt Lake Valley.  

Observations from the USGS at the Saltair Boat Harbor show that the highest lake elevations since 2007 were achieved in 2013 when the lake was near 4199 feet.  Last year, we bottomed out at 4190.4 feet, which is the record low at this site.  The recovery this spring was limited.  


The latest provisional data since June 1 shows the general downward trend with measurements since July 2 near or below 4190.4 feet, the current record. 


Lake-elevation observations are tricky, so the USGS will need to weigh in on whether or not we are "officially" at the record low, but it appears we are close.  With a few months of decline likely to come, we will easily beat that record by the end of fall and may drop down to near 4189 feet.  

A lot of people ask me about the future of the lake.  In the short term, a best-case scenario would be a return to snowier winters that we have generally seen over the past two decades.  Some temporary recovery would be possible if that occurred. On the other hand, shrinkage will continue if we see the drought persist.  Efforts to increase natural flows to the lake will help slow the shrinkage, but in the long term, I suspect aridification due to climate change will make "saving" the Great Salt Lake as we know it very difficult without importing water.  

Sunday, July 3, 2022

Hairdryer Conditions

Heat, wind, low relative humidity.  Hairdryer conditions are dominating the weather story over northern Utah this holiday weekend.  

Meteograms for the Salt Lake City International Airport (KSLC) over the 24-hour period ending at just after noon today (Sunday, July 3rd) illustrate this well.  Yesterday afternoon, temperatures hovered near 100˚F (the official high was 101˚F) with dewpoints in the mid 20's and the relative humidity below 10%.  Winds gusted as high as 38 mph.  

Today is pretty much a repeat.  

For drying out the landscape, this is about as bad of a pattern as you can have.  

Sadly, the monsoon moisture isn't that far away.  The NAM forecast for this afternoon shows a sharp contrast in low-level relative humidity between western Utah and western Colorado (see lower left panel below), with considerable shower and thunderstorm activity over the latter.  


Both regions are in southwesterly flow.  The difference is origin.  In western Utah, our flow is moving around the upper-level low off the Pacific Northwest Coast and originates in the dry belt over the eastern Pacific.  In contrast, in western Colorado, the flow is moving around the upper-level ridge centered over the southern Plains and originates over the Gulf of Mexico.  The confluence of these two airstreams creates a sharp contrast in weather.  This is a common pattern during the monsoon and one of the reasons why eastern Arizona, New Mexico, and Colorado are more active than northern Utah.  

Your best option for this weekend is to stay in the shade or at high elevation, drink a lot of water, and don't play with fireworks.

Friday, July 1, 2022

June and July

I have very little intuition for what Utah experienced in June.  I was gone for nearly the entire month.  I didn't see a temperature above 80˚F for 3 weeks in Ireland and England and experienced a 12-day stretch in Ireland when I didn't see anything above 70˚F.  In a word.  WONDERFUL.  

The numbers for KSLC, however, show that June was warm compared to climatological norms with an average temperature of 74.7˚F, rating as the 8th warmest on record.

Source: NOAA Regional Climate Centers

A look at the time series above and the top-10 warmest June's on record below shows that the dice have been loaded for warm Junes at KSLC in the 21st century and especially since 2010.  

Source: NOAA Regional Climate Centers

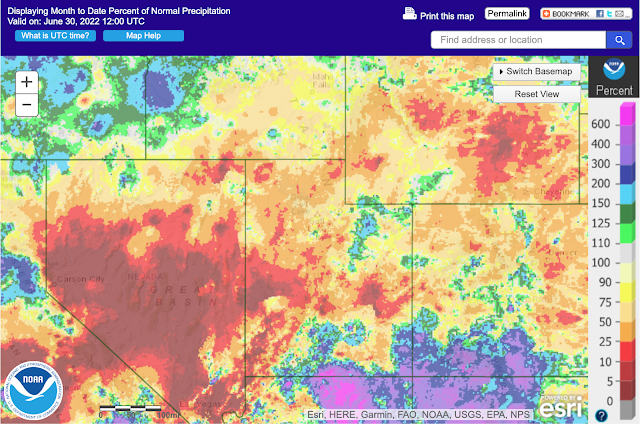
For precipitation, 0.56" was recorded at KSLC, which is a shade below median for the month.  Anecdotally, it seems it's remarkably green around here for late June, so perhaps the timing or antecedent moisture have been good for the plant health.  Looking statewide, the story varies considerably depending on location with a few areas well below average, a few well above, and much of the state near or just below.  Such is the fickle and localized nature of precipitation during the warm season.  

Source: https://water.weather.gov/precip/

We now enter July, when hope is limited in northern Utah.  Every now and then we might get a surprise trough or sustained monsoonal flow, but it is not the hottest and driest month climatologically for nothing.  I'm not optimistic. Thoughts and prayers.