Showing posts with label Great Salt Lake. Show all posts

Friday, July 17, 2026

Update on the Great Salt Lake

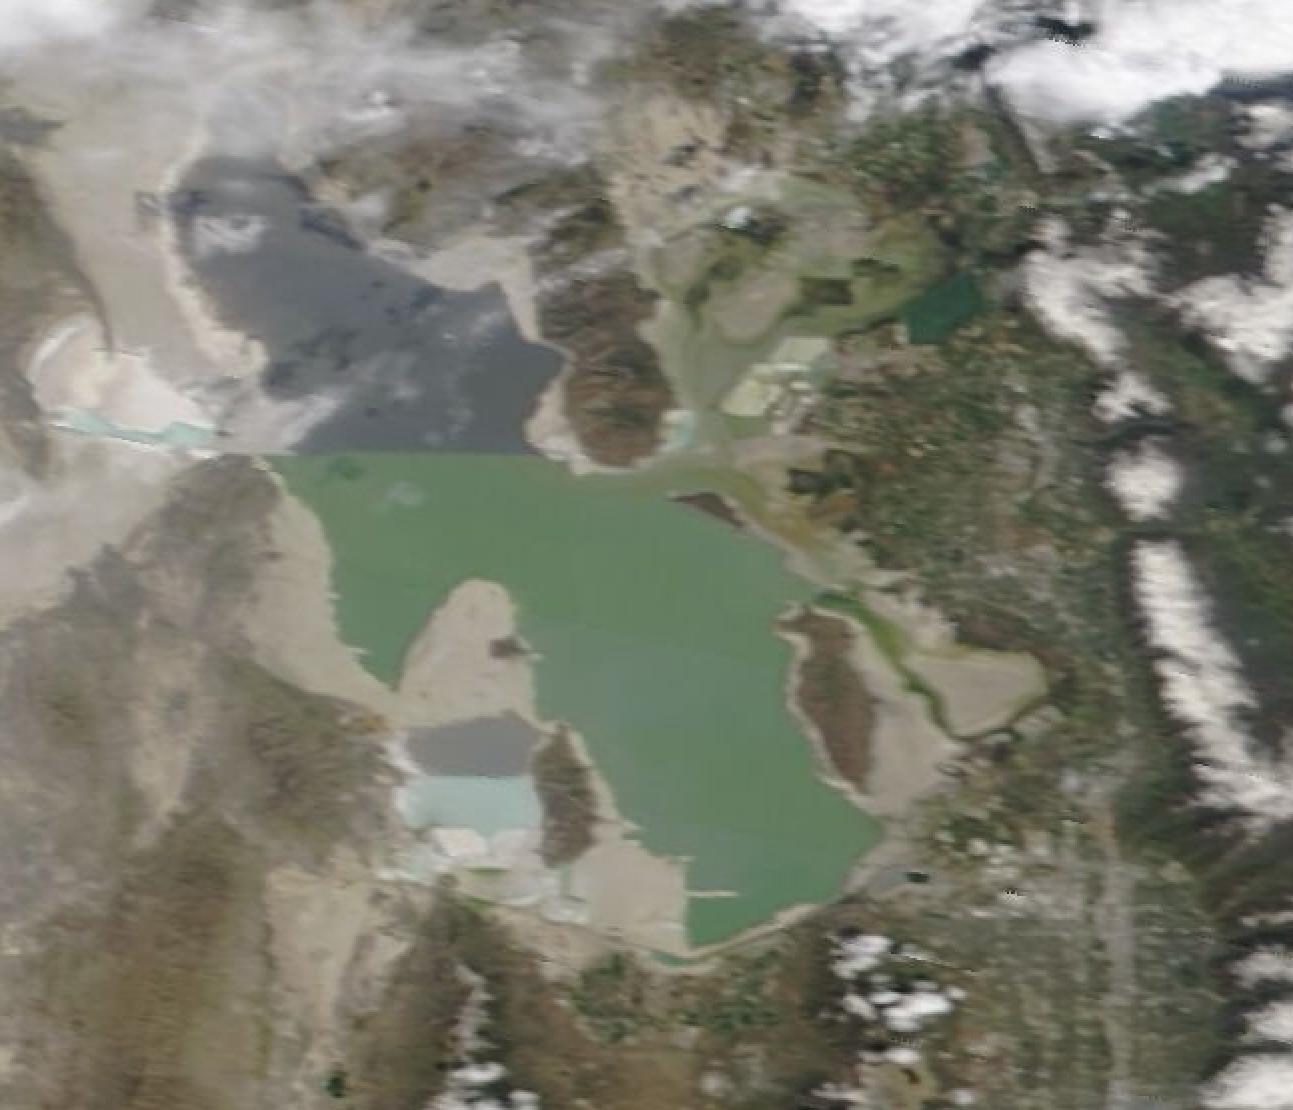
Mid July is here and it's worth a look at the Great Salt Lake.  Satellite imagery from July 11, when northern Utah was cloud free, showed considerable lake bed exposed in the Bear River and Farmington Bays.  

Source: https://worldview.earthdata.nasa.gov/

Elevation data shows that both the north and south arms had early and broad peaks in April and began to decline in earnest around mid May.  The north arm currently sits at an elevation fo 4190.5 feet and the south arm at 4190.9 feet.  Each of these above their respective record minimums in 2002, which were a bit below 4189 feet.  It's unlikely we will get down that low this year, but getting below 4190 seems to be in play.  

Source: https://greatsaltlake.utah.gov/current-conditions

Next winter will be critical for whether or not we end up flirting with a record minimum again.  There are good reasons to root for a good snow year besides skiing. 

Sunday, August 3, 2025

A Brief But Intense Lake-Dust Event

Late yesterday afternoon, strong winds associated with outflows from storms to the north brought a brief but intense lake-dust event to the Salt Lake Valley.  Satellite imagery showed this dust moving southward through the Salt Lake and Utah Valleys.

Source: CIRA.  Loop also available at https://col.st/80KK0

Take a close look at that look, especially the last few frames, and you can also see an area of dust moving off of the Farmington Bay playa and over the south arm of the Great Salt Lake.  There's also evidence of dust from other sources to the west moving through the Skull, Tooele, and Rush Valleys.

Winds at the University of Utah began to pick up at around 1835 MDT when increased to more than 9 mph with gusts to 12 mph.  The peak gust of 20 mph occurred at 1852.  This roughly bracketed a spike in PM2.5 concentrations to just over 8 ug/m3 from 1845-1850 UTC. 

Source: Mesowest

Although the PM2.5 concentrations were not very high, that measurement focuses on smaller particles less than 2.5 microns, whereas wind-blown dust from the lake often contains larger particles and is better measured by instruments that focus on particles up to 10 microns (called PM10).   

Events yesterdays are typical of most July-August dust storms.  They tend to be intense but shortlived and generated by precipitation falling into sub-cloud dry layers, which leads to evaporative cooling.  The evaporatively cooled air spreads outward from the precipitation region, often resulting in strong winds.  The leading edge of this outflow is sometimes referred to as an outflow boundary or gust front.  Often you can see several, which can merge and interact, as evident in yesterday's satellite loop. 

If the lake was full, dust would have been more limited.  Some of us might have only felt a cool and refreshing north wind.  Wouldn't that have been wonderful. 

Wednesday, July 30, 2025

More on the Decline of the Great Salt Lake

A couple of weeks ago I commented on the net decline of water in the Great Salt Lake over the past year (see Status of the Great Salt Lake).

Following a media briefing by Great Salt Lake Commissioner Brian Steed, the low lake levels are now getting press coverage in the Salt Lake Tribune (see Great Salt Lake again dips to 'scary low level') and Deseret News (How is the health of the Great Salt Lake).  

This year's decline is especially disappointing because our April 1 snowpack was 96 to 109 percent of median in basins that drain to the Great Salt Lake.    

Source: NRCS

Although snowpack measured by SNOTEL stations on April 1 doesn't tell the whole spring runoff story, it's not encouraging that we will probably see about a 2 foot decline in lake level in a year during which we reached close-to-median snowpack.

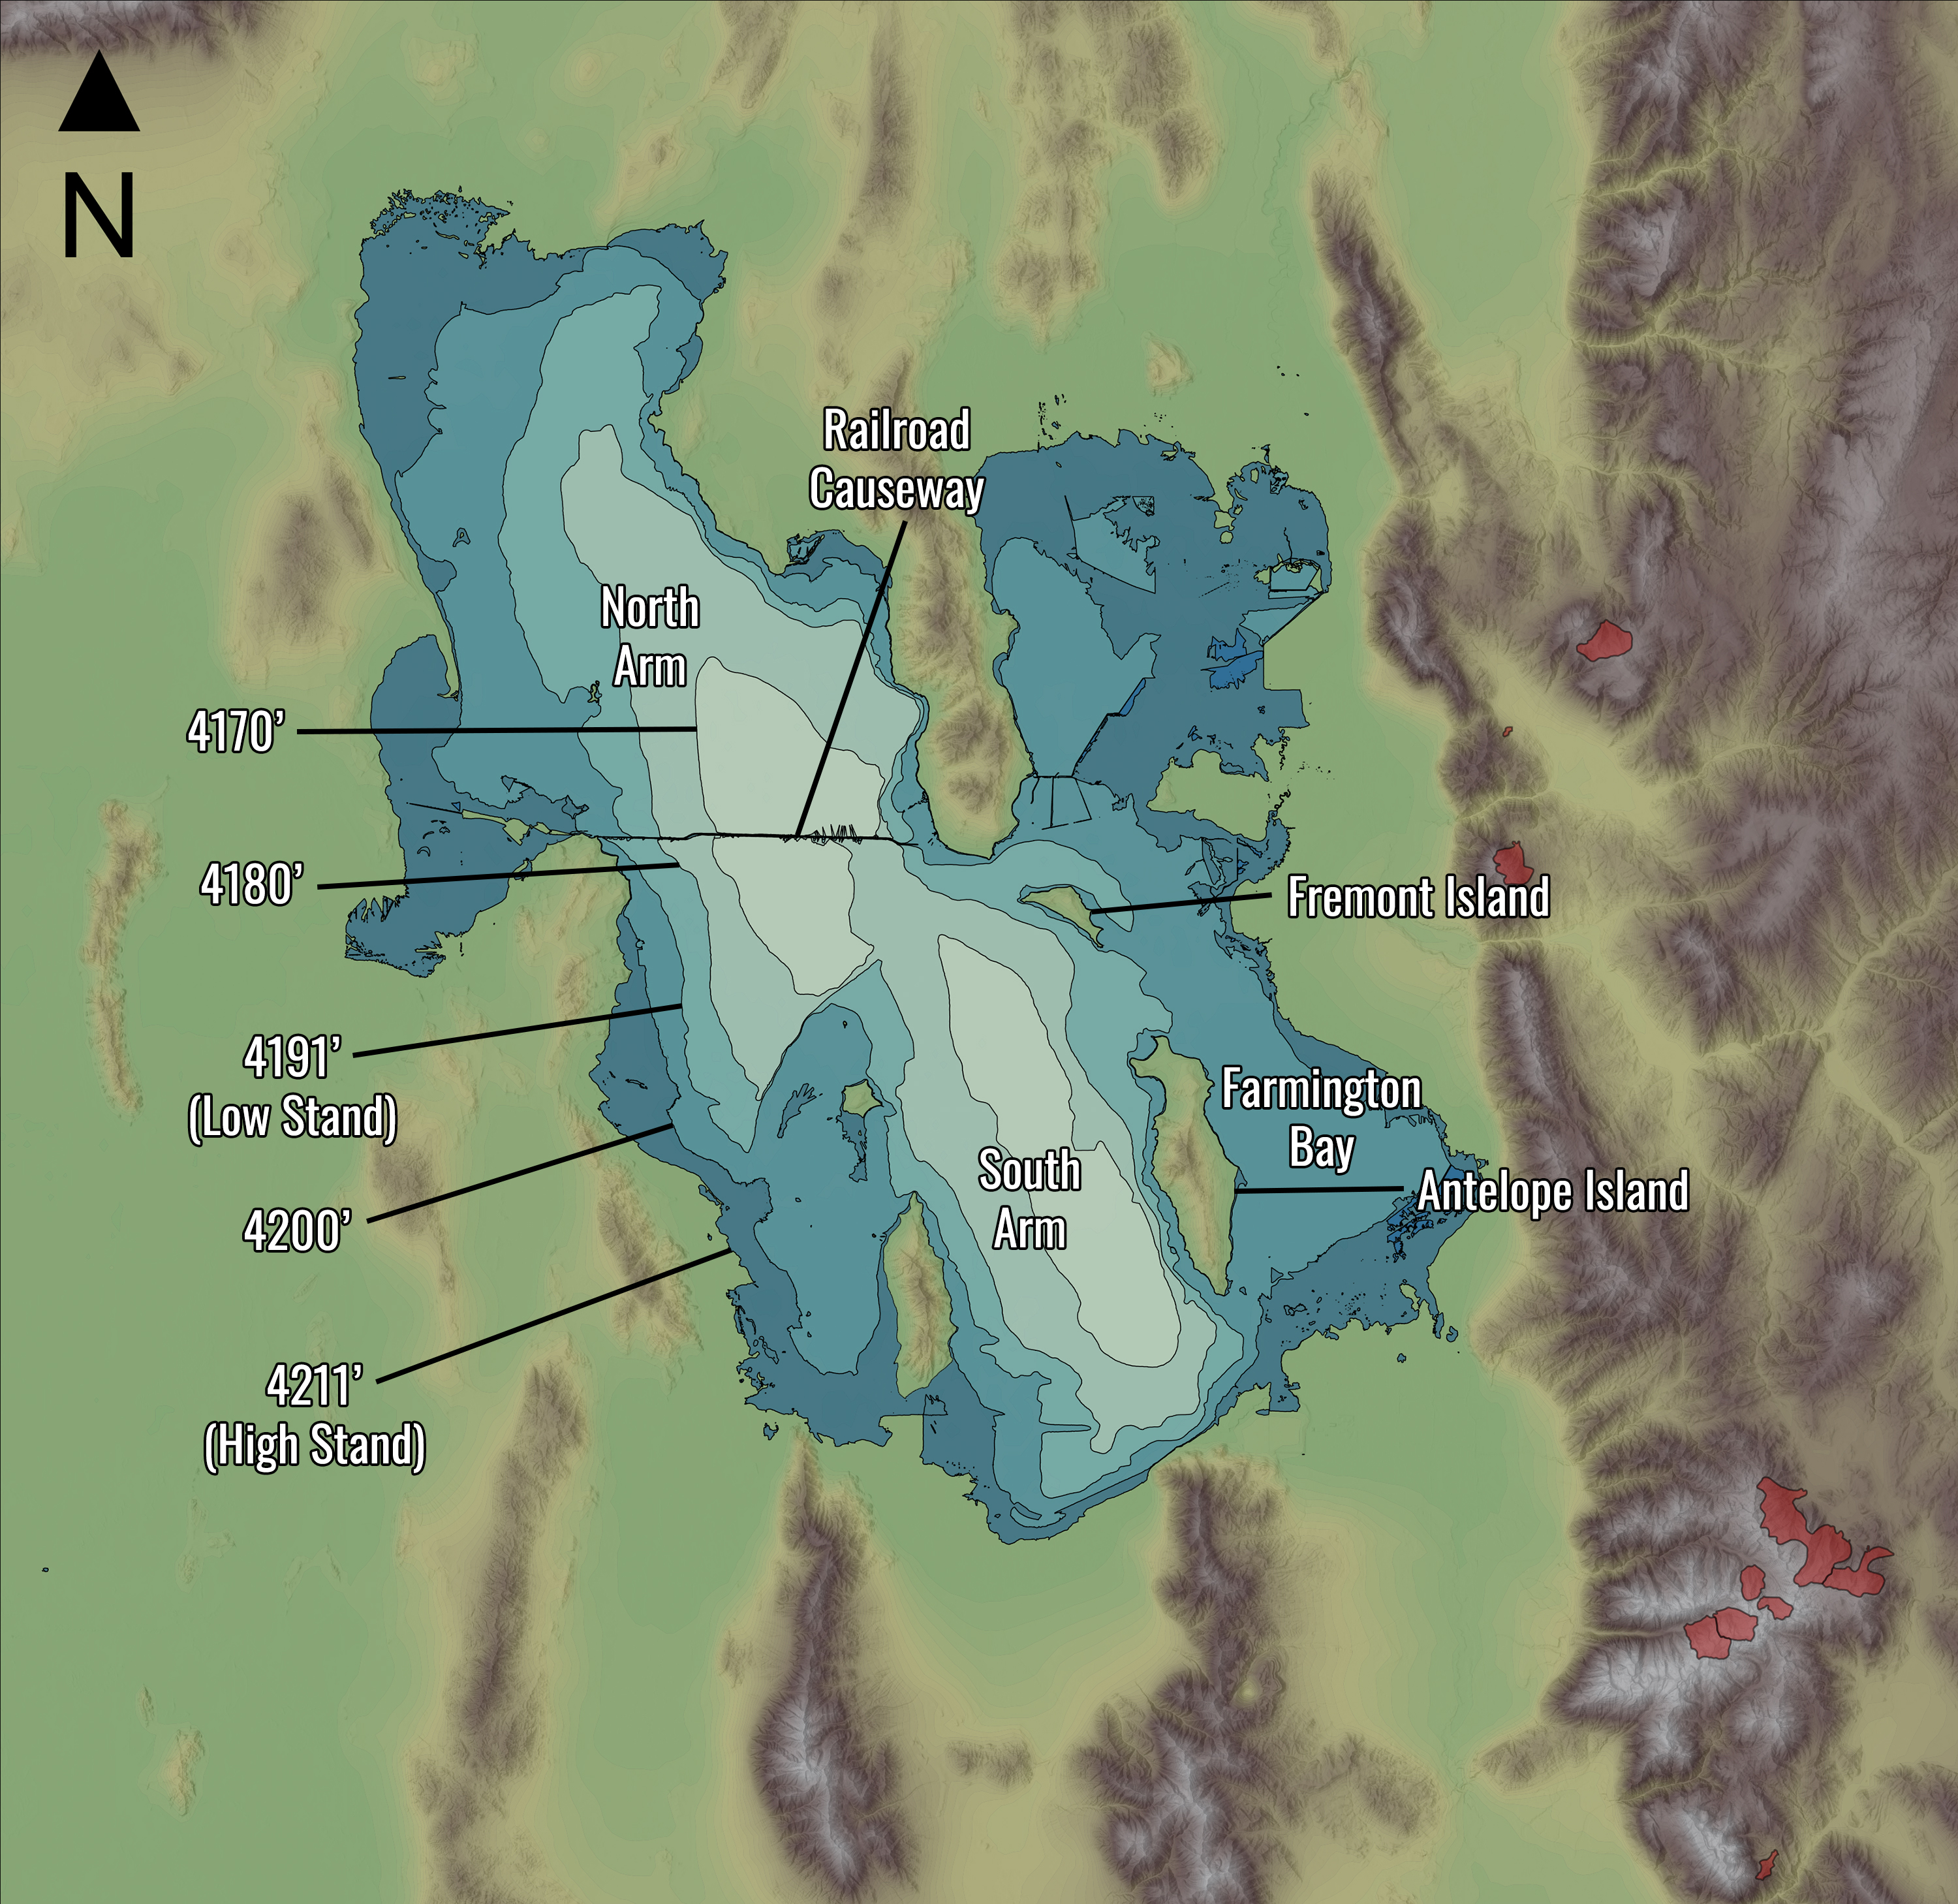
The figure below has been adapted from the 2nd Edition of my book Secrets of the Greatest Snow on Earth and shows the area of the Great Salt Lake at several elevations.  We are currently at 4192 feet in the south arm and a bit under 4192 feet in the north arm, so just a bit above the 4191 foot level that is indicated.  

As we dip below this level and approach 4180 feet, the Great Salt Lake begins to become increasingly confined to a northwest to southeast oriented corridor.  

A Great Salt Lake if we can save it.  A Great Salt Finger Lake if we can't.  

Monday, July 14, 2025

Status of the Great Salt Lake

The current elevation of the Great Salt Lake at Saltair Boat Harbor on the south shore is 4192.4 feet.  Although this is above the record minimum from 2022, it is still well below the long-term average of 4200 feet and the so-called minimum health level of 4198 feet.  It has now been about 13 years since we were last at that minimum healthy level. 

Source: USGS

A look over the past year shows a net decline in elevation on this date of nearly 2 feet.  Lake levels will decrease further in the coming months as they typically decline through the summer and fall.  Last year we dropped about 2 feet after this date. 

Lake elevations over the past year at Saltair. Source: USGS

The current elevation at Saline in the north arm is 4191.9 feet, which is very close to where it was last year. 

Lake elevations over the past year at Saline. Source: USGS

So it's a "push" in the north arm and a net loss in the south arm, which means a net decline for the entire lake system, 

Yesterday's crystal-clear skies provided a great view from NASA's MODIS instrument.  There's still a bit of water in Bear River Bay and a sliver in Farmington Bay, but for the most part, those bays are desiccated of water coverage.  

Source: NASA

Keep rooting for big snow years.  We need a few of them. 

Monday, August 5, 2024

How Much Water Is in the Great Salt Lake?

Aqua/Modis Satelite Image of the Great Salt Lake on 4 Aug 2024

It is not uncommon to see reports of recent or long-term trends in the Great Salt Lake characteristics based on lake elevation.  This is a quantity that is measured at three locations, two with a fairly long record.  The first is Saltair in the south arm of the great Salt Lake.  The second is Saline in the north arm.  

While convenient, they often differ by a decent amount.  This is because the lake is separated by a rock fill railroad causeway which limits the transfer of water between the two halves.  This results in differences in lake elevation (the south arm is typically higher), salinity (the north arm is saltier), and even color (see above; for an explanation see https://wildlife.utah.gov/gslep/about.html.)

However, with a little information about the lake bathymetry (i.e., the underwater terrain of the lake), one can take the elevations from Saltair and Saline, estimate the area and volume of each half of the lake, and combine them into a total area and volume for the lake.  Thanks to work by Utah State University and the USGS, tables to convert from elevation to area and volume are available at https://pubs.usgs.gov/of/2005/1327/PDF/OFR2005-1327.pdf and https://pubs.usgs.gov/of/2006/1359/PDF/ofr2006-1359.pdf, respectively.  These are based on 1/2 foot lake elevation intervals.

Based on recent readings rounded to the nearest half foot, I thought I would look at changes from August 2022, when the lake was approaching its historical minimum elevation to August 2024, the summer after two above average snowfall years.  Here's what I got.

Aug 2022
Saltair/Saline Elevations: 4189.6/4189.4 ft
Estimated Lake Area: 605,242 acres
Estimated Lake Volume: 7,419,322 acre-feet

Aug 2022
Saltair/Saline Elevations: 4193.6/4191.8 ft
Estimated Lake Area: 649,320 acres
Estimated Lake Volume: 9,528,374 acre-feet

So, in this two year period, the lake area has increased about 7% and the volume has increased about 28%.  

Feel free to pull the numbers and check my math.  However, one can see why the the former has gone up more slowly as a percentage based on the graph below which shows the volume and area as a function of lake elevation in the south arm (also known as Gilbert Bay).  Note that the slope of the area curve becomes =greater above about 4194 feet.  Basically, the lake "bathtub" has steep walls up to 4195 feet, so a given volume of water increases the area less than at higher elevations where the "bathtub" walls are more gentle.  

Source: https://www.usgs.gov/media/images/great-salt-lake-hypsographic-curve

I've used the words "estimated" above because lake bathymetry does have some uncertainties, I'm rounding off noisy lake-elevation data, etc.

If someone knows of a website that provides data on area and volume calculated based on the elevation data in the two halves of the lake, please share in the comments below.  I think that would be extremely useful to have updated monthly to better understand what is happening in each half and for the lake as a whole.

Friday, June 21, 2024

Great Salt Lake Seasonal Maximum

Data collected from the USGS at Salt Air suggests that the elevation of the south arm of the Great Salt Lake reached its seasonal maximum in May at about 4195 feet and is now declining.  

Source: https://waterdata.usgs.gov/

Data for this location extend back to 1847, so we can put the 4195 foot elevation into historical context.  There are two prior periods where lake levels dropped below 4195 feet.  The first was from about 1934–1946 when the lake episodically went below 4195 feet.  The second was from about 1959–1971 when the lake dropped to just below 4192 feet and was below 4195 feet for a several year stretch with episodic drops below that level in surrounding years.  
https://waterdata.usgs.gov/

The north arm remains lower than the south arm and is currently at an elevation of about 4193 feet.  

A real question moving forward from here is will our string of high snowfall winters continue?  Let's hope so.

Friday, September 8, 2023

The Great Salt Lake Is Still on Life Support

The situation report for the Great Salt Lake is still quite concerning.  Although it is true that the south arm of the Great Salt Lake rose just over 5 feet during the spring runoff, the reality is that this was accomplished due to a remarkably anomalous heavy snow season combined with plumbing the rock causeway that divides the lake to keep most of the inflow in the south arm.  

Below is the landsat satellite image for the 29th of August 2022 (i.e., last summer) when the lake elevation was about 4189.3 feet and approaching its record low that fall.  Considerable lake bed is exposed all around the lake, including along the east side in the Bear River and Farmington Bays. 

Source: https://glovis.usgs.gov/app

Shift to this year and there is some greater coverage in the Bear River Bay and near Antelope Island, but extensive exposed playa remains and there has been little discernible change in the coverage of the North Arm, at least with a quick glance at these images (more on this in a minute). 

Lake elevation measured at Saltair on the south shoreline shows a substantial increase from the historical minimum just below 4189 feet last fall to about 4194 feet in June.  Since then, the lake level has declined about a foot and a half to 4192.5 feet today.  

Source: https://waterdata.usgs.gov/

A fall minimum just below 4192 feet seems likely.  Keep in mind that until this latest low stand, the historical record low elevation was 4191.35 feet in 1963.  Basically, we are now just a bit over a foot above that.  

The Great Salt Lake is divided in half by a rock-fill causeway that limits the flow of water between the two halves.  Due to efforts to restrict flow between the two halves and raise water levels in the south arm, the spring recovery there was more limited.  In fact, water levels there peaked out about a foot below the prior year, although the decline this year has been less abrupt and it currently sits at 4189 feet, just a bit above last summer.  

Source: https://waterdata.usgs.gov/

So, if you need another reason to root for another big snow season, this is it.  The Great Salt Lake is still on life support.  

Tuesday, July 4, 2023

Status of the Great Salt Lake

Several media outlets are reporting this week that the Great Salt Lake appears to have crested for the summer.  For example, the Salt Lake Tribune reported today that the lake entered the week at 4,193.8 feet elevation at the Great Salt Lake State Park Marina, which is 3.5 feet higher than last year at this time and 5 feet above the record low in November.  

That is of course good news.  However, it is somewhat misleading.  A rock-fill causeway has divided the lake for decades.  Essentially, the Great Salt Lake is two lakes, and that is especially true today because the berm in the causeway between the north and south arms of the lake was raised in February.  Most of the freshwater inflow to the lake enters the south half, so this has helped to lower the salinity in the south arm (important for brine shrimp), but it has also enabled the south arm to rise more rapidly since the flow to the north arm has been reduced.  

We can see this in lake-elevation data collected by the USGS.  At Saltair in the south arm, the lake elevation currently sits at 4193.9 feet, which is more than 5 feet higher than last November.

Source: USGS

However, at Saline in the north arm, the lake elevation currently sits at 4189.4 feet, 4.5 feet lower than in the south arm.  Lake levels have only climbed about a foot over where they were last fall and winter (note scale change).  


This contrast can be seen in Landsat imagery from last week.  Note how coverage of water to the south of the causeway, which extends westward from the southern tip of Promontory Point, is greater than to the north side.  This is especially noticeable on the west shore.  Note also that the coverage of water has improved quite a bit, although there is still considerable lake-bed exposed in the Farmington Bay area immediately north of Salt Lake City.  

Source: https://glovis.usgs.gov/app

From an ecosystem management perspective and perhaps local dust sources, there are good reasons to have captured most of the water in the south arm.  It is possible that if the lake continues to remain low, that a decision may eventually be made to let the north arm whither and focus on saving the south arm (there are also disadvantages to doing this).  

That said, I'm not a fan of using the Saltair elevation in isolation as a measure of lake changes.  It only tells half the story (perhaps a bit more than half since the south arm is larger than the north arm).  We are very fortunate to have had a big snowpack this year, but my view is that the lake is still in critical condition and the elevation of the south arm paints a picture that is rosier than reality.  

Wednesday, May 24, 2023

Great Salt Lake Update

The Great Salt Lake at Saltair* rose 4.7 feet from 4188.7 feet on October 1st of last year to 4,193.4 feet on May 1st of this year.  That's a big increase, but it is still very low.  The graph below illustrates the lake elevations at Saltair based on data from the USGS.  The orange line indicates the 4193.4 ft level, showing that the current elevation is still below all but the low stand in the early 1960s, recent seasonal minimums in the fall, and the drawn out low period of the past couple of years.  

Lake elevation at Saltair since 1847 (USGS data)

You may have noticed the asterisk above.  Saltair provides long-term records for the south arm of the lake, but the rock-fill railroad causeway dividing the lake in half can cause elevation imbalances.  Additionally, the berm in a gap in the causeway was raised recently.  As a result, while the south arm receives most of the freshwater runoff and has risen a lot, the north arm has only climbed slightly to 4189.2 ft.

Lake elevation at Saline since 1966 (USGS data)

Landsat imagery from last May and this May shows more water in Farmington Bay, Ogden Bay, and the Bear River Bay.  However, large expanses of lake bed remain exposed in Farmington Bay and on the western side of the lake.  

Source: https://glovis.usgs.gov

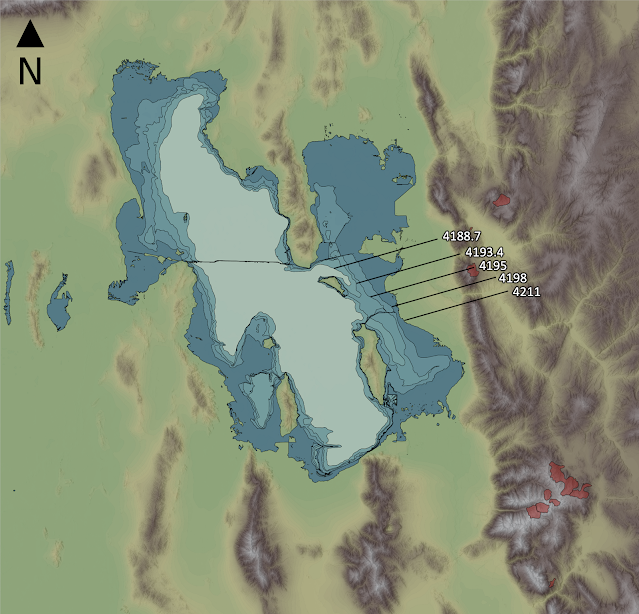
We will probably see lake levels rise for a few more weeks.  Below is a bathymetric map of the lake that includes the 4188.7' (historical low), 4193.4' (current), 4195', 4198' (functional low), and 4211' (historical high) elevations.  Perhaps the south arm will get a bit above 4195', although that's really just a guess. on my part. 


Note that the map above assumes a level lake.  Lake elevation, coverage, and shorelines do fluctuate due to wind, inflows, and other effects.   

Anyone want to set the over/under for peak lake elevation at Saltair?

Thursday, May 18, 2023

Great Salt Lake Bed Dust

 Yesterday evening, while out for a walk, I noticed a wall of dust over the western Salt Lake Valley.  

After returning home, I took a look at a video from the west-facing camera my department operates at the University of Utah and it showed a remarkable plume originating to the north and presumably from the exposed Great Salt Lake bed in what used to be Farmington Bay.


Much has been made about the snowpack, runoff, and rise of the lake.  Indeed, the lake elevation at Saltair Boat Harbor has increased over 4 feet from its record low last fall.  It currently sits at about 4193.3 feet, but that is still remarkably low as can be seen by the elevation graph below for the past 40 years.  


As a result, the lake area remains low and lake-bed is still exposed in many areas, including much of Farmington Bay (east of Antelope Island) which I suspect was the source of yesterday evening's dust (image below from May 15).  

About a month ago, it was anticipated that the lake would eventually rise to 4195 feet with this year's runoff.  That's a big increase, but it is still below what is viewed as the optimal lake zone between 4198 and 4205 feet.  

Wednesday, February 8, 2023

Great Salt Lake Strike Team Report

The Great Salt Lake Strike Team issued a report today that serves as a resource for the 2023 General Legislative Session.  The full report is available here.  It's a little unfair to call it a report as much of the document is a visual summary with bulleted lists and highlights, which makes the key findings very accessible.  

Perhaps the most important insight is a clear summary of the causes of the record low lake elevation.  The largest contributor is human consumptive use, with declines in precipitation and runoff efficiency and increases in direct evaporation from the lake due to climate warming smaller contributors.  

As I often say, we have met the enemy, and it is us.  In the short term, finding ways to reduce human consumptive use is probably the most important policy lever for getting water to the lake.  The report recommends that we should leverage wet years to do this, and it was good to see that they highlight that this year, given our relatively healthy snowpack, represents a significant opportunity.  

Given how well laid out and succinct the report is, I refer you to the report for additional insights and recommendations.  

Thursday, November 10, 2022

A Deep Dive into the Great Salt Lake Effect

This is a reproduction of a report prepared and presented to the Great Salt Lake Advisory Council at their 14 September 2022 meeting.  It has been modified for formatting, to remove personal information, and to correct a few typos.  I thank students and colleagues whose research or comments contributed to and improved the manuscript.

Contributions of Lake-Effect Periods to Precipitation and Streamflow in Northern Utah

W. James Steenburgh
Professor of Atmospheric Sciences
University of Utah

Executive Summary

Lake-effect periods are sometimes produced during cold-air outbreaks over the Great Salt Lake, contributing to snowfall and streamflow in the surrounding mountains. Prior research indicates that precipitation produced by lake-effect periods is greatest south and southeast of the Great Salt Lake and contributed 5.1-8.4% of the cool-season (16 September – 15 May) precipitation at observing sites in the Cottonwood Canyons and Oquirrh Mountains from 1998–2009. During this study period, the lake was at or below its average historical area. No studies have carefully examined the long-term influence of lake area on lake-effect precipitation or the contribution of lake effect to streamflow, underscoring the need for further research in these areas. Studies do indicate that salinity reduces the coverage and intensity of lake-effect storms and could exacerbate precipitation losses should lake levels and area continue to decline.

1. Introduction

The Great Salt Lake is the largest body of water in the contiguous western United States and the largest salt lake in the western hemisphere. It is a terminal lake with no outlet, so its elevation and area change because of variations and trends in climate, including snowfall, streamflow, and evaporation, as well as water diversions for human activities. Historical levels at Saltair on the south shore have been as high as 4211.6 feet in 1986 and as low as 4190.4 in 2021, although preliminary data indicate that the lake dropped below this level during the summer or 2022 (Lake surface elevations based on the USGS observing site at Saltair Boat Harbor (1001000) and based on National Geodetic Vertical Datum of 1929 (NGVD 1929). Elevations north of the Union Pacific rock-fill railroad causeway may differ after completion of its construction in 1959.).  Correspondingly, the lake area has been as large as 3,300 square miles and as small as 950 square miles (Figure 1).

Figure 1. Landsat satellite imagery of the Great Salt Lake based on data collected in September 1987 (left) and April/May 2021 (right) when the lake was near its high and low stands, respectively.  Images courtesy of the U.S. Geological Survey.  

Due to the accumulation of sodium chloride and other salts, the Great Salt Lake is hypersaline and much saltier than ocean water. There is a stark salinity contrast between the northern and southern halves of the lake, which are separated by a rock-fill railroad causeway that limits mixing between the two halves. The northern half receives very little freshwater inflow and typically has a salinity near 27%. The southern half receives most of the freshwater inflow and has a salinity that has been as low as 6% during higher lake stands, but since 2010 has varied between 10 and 18%. For comparison, ocean water has an average salinity of 3.5%. Lake salinity can be locally low near freshwater inlets.

The Great Salt Lake is also very shallow. At an elevation of 4200 feet, it has an average depth of 16 feet and a maximum depth of 33 feet. As a result, the lake-surface temperature responds relatively quickly to changes in air temperature associated with fronts and other weather systems. It also warms quickly in the spring, which contrasts with larger, deeper lakes such as the Great Lakes of eastern North America, which tend to warm or cool more slowly in response to weather systems and seasonal changes. During winter, because of its salinity, the Great Salt Lake develops little ice and can achieve low temperatures (near 28˚F). 

The Great Salt Lake has multifaceted influences on the climate and water resources of northern Utah. As directed by the Utah Department of Natural Resources and Great Salt Lake Advisory Council, this report summarizes current understanding of the influence lake-effect precipitation generated by the Great Salt Lake on precipitation and streamflow.

2. The Great Salt Lake effect

a. What is lake-effect precipitation? 

Lake-effect precipitation is precipitation that is produced or enhanced when cold air passes over a relatively warm body of water. This occurs due to the transfer of heat and moisture into the atmosphere, which destabilizes the atmosphere and leads to atmospheric circulations that initiate and organize clouds and precipitation systems. Lake-effect and related sea- or ocean-effect precipitation often falls as snow, although it can fall as rain, especially in the fall or spring at lower elevations in warmer climates. The most prolific lake-effect snowfall occurs in the snowbelts near the Great Lakes of eastern North America and in the heavy snow region of Japan near the Sea of Japan where frequent cold-air outbreaks occur over large water bodies. Less prolific but sometimes disruptive lake-effect storms can also be produced by smaller water bodies including the Great Salt Lake, Utah Lake, Bear Lake, Pyramid Lake, and Lake Tahoe. The water that falls in these storms can be traced back to both the upstream atmosphere and evaporation from the lake surface. For small lakes, upstream moisture is often critical for lake-effect development.

b. Characteristics of the Great Salt Lake effect

Great Salt Lake-effect precipitation occurs most frequently during cold-air outbreaks following the passage of a cold front when the flow is westerly, northwesterly, or northerly. The development, intensity, and coverage of lake-effect precipitation depends on several factors including the lake temperature and salinity, air temperature and humidity, wind direction and speed, and other factors. Additionally, low-level flow convergence frequently initiates and organizes lake-effect clouds and precipitation. Such convergence can be produced by flow interactions with the topography or land breezes from the lake shorelines (Figure 2).

Figure 2: Schematic depiction of the convergence of land breezes and the development of a lake-effect storm over the Great Salt Lake.  Source: Steenburgh (2014).  © University Press of Colorado.

Most Great Salt Lake-effect precipitation periods are disorganized and produce scattered or widespread precipitation (Figure 3a). Sometimes they organize into narrow bands that produce heavy, localized snowfall with rates that can approach 3 inches per hour (Figure 3b). It is also possible for lake effect to enhance or occur simultaneously with other precipitation features (Figure 3c). For this reason, it is not possible to completely disentangle lake-effect and non-lake-effect precipitation.

Figure 3. Radar imagery of a) widespread lake-effect precipitation, b) banded lake-effect precipitation, and c) lake-effect precipitation with other precipitation features.  Source: Alcott et al. (2013).  © American Meteorological Society. 

The ability to identify and monitor Great Salt Lake-effect precipitation increased significantly in 1994 with the installation of a NOAA/National Weather Service radar on Promontory Point. The characteristics described below are based lake-effect periods identified during the 1998 to 2010 cool seasons (16 September to 15 May). During this study period, the area of the Great Salt Lake declined from 1750 to 1200 square miles, which corresponds to near average (1700 square miles) and roughly halfway between average and the historical minimum (950 square miles).

During this study period, there were an average of 13 lake-effect periods per cool season with as few as 3 in 2005 and as many as 20 in 2010. Many of these periods were short lived, with less frequent but intense periods responsible for most of the precipitation accumulation (see section 2c). Lake-effect periods were most common from mid-October to mid-December and in early April. The early April peak is unusual compared to other bodies of water that are deeper and tend to be cold in the spring. In contrast, the shallowness of the Great Salt Lake allows it to warm rapidly, enabling it to generate lake-effect precipitation in the spring when a cold-air outbreak occurs after a warm period.

c. Contribution of lake-effect periods to cool-season precipitation

Estimating the contribution of lake-effect periods to cool-season precipitation and snowpack is not straightforward. For the estimates below, we identified lake-effect periods using radar imagery from the 1998–2009 cool seasons and determined how much precipitation they produced at National Resources Conservation Service (NRCS) Snowpack Telemetry (SNOTEL) stations. The estimates include some non-lake-effect precipitation since there are times when lake effect enhances or occurs with precipitation produced by other weather systems. On the other hand, it is possible that the lake influences or enhances some mountain snowstorms in ways that are not easily identified in radar.

During the study period, precipitation during lake-effect periods was greatest at SNOTEL stations in the Cottonwood Canyons and the Oquirrh Mountains (Figure 4a). In the Cottonwood Canyons, the average cool-season water equivalent precipitation during lake-effect periods was 2.06 and 2.38 inches at the Mill D North (Big Cottonwood Canyon) and Snowbird (Little Cottonwood Canyon) SNOTEL stations, respectively. In the Oquirrh Mountains it was 2.12 and 2.37 inches at the Rocky Basin-Settlement (Settlement Canyon) and Dry Fork (Butterfield Canyon) SNOTEL stations, respectively. In the Wasatch Range, average cool-season liquid equivalent precipitation during lake-effect periods generally decreased northward of the Cottonwood Canyons with 1.46, 1.61, 1.59, and 1.01 inches at the Parleys Summit, Lookout Peak, Farmington, and Ben Lomond Peak SNOTEL stations, respectively. Values at other stations ranged from 0.33 to 1.32 inches, the latter at the Payson Ranger Station southeast of Utah Lake. At some of these sites, especially those in the Bear River Range and western Uintas, much this precipitation was produced by non-lake-effect precipitation features that occurred simultaneously with lake-effect precipitation.

Figure 4. a) Water equivalent of precipitation during cool-season (16 September – 15 may) lake-effect periods during the 1998–2009 water years.  b) Fraction of cool-season precipitation produced during lake-effect periods during the 1998–2009 water years.  Lake shores based on high and low stands during the study period with Bear, Weber, and Jordan–Provo River Basins annotated.  Data from Yeager et al. (2013). 

The average fraction of total cool-season precipitation produced during lake-effect periods was 8.4% and 6.3% at Dry Fork and Rocky Basin-Settlement in the Oquirrh Mountains and 5.9% and 5.1% at Mill D North and Snowbird in the Cottonwood Canyons (Figure 4b). The Oquirrh Mountains are drier than the Cottonwoods during non-lake-effect periods, yielding the higher fractions. The lowest fractions are at the Ben Lomond Peak and Trail SNOTEL stations in the northern Wasatch (2.0% and 1.6% respectively).

Observations from Snowbird provide additional insights into the characteristics of lake-effect periods. During the 12 cool-season study period, just 13 lake-effect periods, or about 10% of the periods, produced 50% of the lake-effect precipitation at Snowbird. Thus, approximately one large storm per year was responsible for half of the lake-effect precipitation at Snowbird, equating to about 1.2 inches of water equivalent. From year-to-year, the amount of cool-season precipitation during lake-effect periods at Snowbird varied from as high as 5.04 inches in the 2002 water year (about 12% of the precipitation that cool season) to as low as 0.51 inches in the 2003 water year (about 1% of the precipitation that cool season). Such a wide swing in back-to-back years illustrates that year-to-year variations in lake effect cannot be explained solely due to changes in lake area. Meteorology, especially the frequency and characteristics of cold-frontal passages and associated cold-air outbreaks, also plays an important role. Lake area could have longer-term implications for precipitation, however, as discussed in section 2e.

d. Contribution of lake-effect periods to streamflow

For northern Utah and the major drainage basins of the Great Salt Lake, between 50% and 80% of the annual streamflow occurs during the four-month period of snowmelt (April through July), but even during low-flow periods stream water is predominantly composed of snowmelt that recharged groundwater and is released slowly during the year. The percentage varies from basin-to-basin and from year-to year depending on many factors including the altitude, aspect, and other geographic and ecological characteristics of the basin, antecedent groundwater storage, amount of precipitation that falls as snow and is retained in the end-of-season snowpack, and whether it is a high or low snow season.

To our knowledge, there are no peer-reviewed studies estimating the contribution of lake-effect precipitation to streamflow in any northern Utah hydrologic basin. The estimates in section 2c are the contribution of lake-effect periods to precipitation, which is not equivalent to the contribution to streamflow. With these caveats in mind, we provide some discussion below for general guidance but emphasize that further research is needed.

As discussed in section 2c, the amount of precipitation produced during lake-effect periods is greatest in the Cottonwood Canyons and the Oquirrh Mountains. However, it is likely that the percentage of lake-effect precipitation that is converted to streamflow is higher in the Cottonwoods where there is more high altitude, north-facing terrain and the climatology favors greater precipitation and a deeper snowpack. These factors favor a greater conversion of precipitation to streamflow. Therefore, we anticipate that lake effect contributes to a larger volume of streamflow in Little and Big Cottonwood Creeks than to the creeks issuing from the Oquirrh Mountains. It is possible, however, that lake effect contributes a larger fraction of streamflow to the creeks issuing from the Oquirrh Mountains where precipitation during non lake-
effect periods is lower than in the Cottonwoods.

As described in section 2c, lake-effect periods produced on average 5.1–5.9% of the precipitation at SNOTEL sites in the Cottonwood Canyons during the 1998–2009 cool seasons. It is not known if the contribution of lake effect to streamflow in Little and Big Cottonwood Creeks scales similarly, but we suggest that it may be close. It could even be slightly higher. This is because lake-effect storms tend to be colder, with lower snow levels, thus contributing to a greater fraction of the snowpack at low elevations. Additionally, the addition of lake-effect snow may increase the streamflow yield even the non-lake-effect by creating a deeper snowpack. On the other hand, these relatively low numbers illustrate that non-lake-effect precipitation is the primary driver of streamflow in the Cottonwood Canyons.

The difficulty in relating the small amounts of precipitation associated with lake-effect storms to streamflow arises primarily from the high site-to-site and year-to-year variability in runoff efficiency. In Little Cottonwood Canyon average annual streamflow is 63% of average annual precipitation, but that value ranges from 45% to 80% from year to year. In Big Cottonwood Canyon average annual streamflow is 49% of average annual precipitation but values range from 32% to 65%. Thus, the natural variability in streamflow generation is significantly larger than the lake effect. In addition, a warming climate is resulting in snowmelt beginning earlier and less efficient streamflow generation/ runoff efficiency. Lake-effect snow in the spring can also act to increase how much sunlight is reflected by snow surface, which may delay the melt following a storm. This is likely a small effect but would contribute to more efficient
streamflow generation.

e. Influence of lake size on precipitation

In any given year, lake-effect precipitation depends on lake characteristics and meteorology. During the 1998–2009 study period when the Great Salt Lake area declined from 1750 to 1200 square miles, lake area poorly explained year-to-year variations in lake-effect precipitation. The three biggest lake-effect seasons at Snowbird, for example were 2002 when the lake area was near the 1500 square mile average for the study period, 1998 when the lake area was near the 1750 square mile maximum for the study period, and 2009 when the lake area was near the 1200 square mile minimum for the period. This is because the characteristics of cold-air outbreaks that occur each cool season, especially those that contribute to intense lake-effect periods, also affect lake-effect precipitation. This obscures the signal of lake area if one examines a relatively short period of about a decade.

Nevertheless, it is likely that lake area does influence the characteristics of lake-effect storms and that this would be detectable over a longer record of multiple decades or potentially illustrated using regional climate modeling. We are unaware of any peer-reviewed studies that have attempted to do this. Further, we suggest that there may be tipping points at which a small change in lake elevation (and area) produce is a significant shift in lake-effect characteristics. Lake elevation affects not only area but also shape, which in turn influences the characteristics of lake-effect storms. At high-stand (4211 feet) and 4200 feet elevations, the Great Salt Lake occupies the Farmington and Bear River Bays (Figure 5). However, near and below the historical low stand (4291 feet), the lake is confined to an elongated region along the axis of the North and South Arms. At these levels, the lake is quite narrow, potentially reducing the range of flow directions that can effectively generate lake effect. For lower lake levels, declines in lake-effect precipitation might be greater, for example, in the Bountiful-area mountains than in the Oquirrh Mountains. Research is needed to explore these effects.

Figure 5. Great Salt Lake coverage at 4211 feet (high stand), 4200 feet (historical average), 4191 feet (low stand), 4180 feet, and 4170 feet.  Great Salt Lake bathymetry source: Tarboton, D. (2017). Great Salt Lake Bathymetry, HydroShare, http://www.hydroshare.org/resource/582060f00f6b443bb26e896426d9f62a. Hillshade sources: Esrii, USGS, FAO, NOAA. 

f. Influences of lake salinity on snowfall

Salinity reduces the transfer of water from the lake to the atmosphere through evaporation. The reduction increases with salinity, especially at high salinities like those found in the north half of the lake. Due to the contrast in salinity, the transfer of water from the lake to the atmosphere through evaporation tends to be greater over the south half of the lake than the north half.

Scientists have incorporated these effects into computer model simulations of lake-effect storms. For one event, the salinity produced a 17% reduction in snowfall compared to a simulation with fresh water. It is likely that increases in salinity accompanying a shrinking Great Salt Lake, which would mainly occur in the south half of the lake, would further reduce lake-effect precipitation.

3. Sources and bibliography 

Alcott, T. I., and W. J. Steenburgh, 2013: Orographic influences on a Great Salt Lake-effect snowstorm. Monthly Weather Review, 141, 2432–2450.

Alcott, T. I., W. J. Steenburgh, and N. F. Laird, 2012: Great Salt Lake-effect precipitation: Observed frequency, characteristics, and environmental factors. Weather and Forecasting, 27, 954–971.

Bardsley, T., A. Wood, M. Hobbins, T. Kirkham, L. Briefer, J. Niermeyer, and S. Burian, 2013: Planning for an uncertain future: Climate change sensitivity assessment toward adaptation planning for public water supply. Earth Interactions, 17, 1–26, https://journals.ametsoc.org/view/journals/eint/17/23/2012ei000501.1.xml.

Brooks, P. D., A. Gelderloos, M. A. Wolf, L. R. Jamison, C. Strong, D. K. Solomon, G. J. Bowan, S. Burian, X. Tai, S. Arens, L. Briefer, T. Kirkham, and J. Stewart, 2021: Groundwater-mediated memory of past climate controls water yield in snowmelt-dominated catchments. Water Resources Research, 57, e2021WR030605. https://doi.org/10.1029/2021WR030605.

Onton, D. J., and W. J. Steenburgh, 2001: Diagnostic and sensitivity studies of the 7 December 1998 Great Salt Lake-effect snowstorm. Monthly Weather Review, 129, 1318–1338.

Steenburgh, W. J., and D. J. Onton, 2001: Multiscale analysis of the 7 December 1998 Great Salt Lake-effect snowstorm. Monthly Weather Review, 129, 1296–1317.

Steenburgh, W. J., S. F. Halvorson, and D. J. Onton, 2000: Climatology of lake-effect snowstorms of the Great Salt Lake. Monthly Weather Review, 128, 709–727.

USGS, 2022: Great Salt Lake, Utah. https://pubs.usgs.gov/wri/wri994189/PDF/WRI99-4189.pdf. Downloaded 3 Aug 2022.

USGS, 2022: Water Quality Samples for the Nation, USGS 10010000 Great Salt Lake near Saline,


Yeager, K. N., W. J. Steenburgh, and T. I. Alcott, 2013: Contributions of lake-effect periods to the
cool-season hydroclimate of the Great Salt Lake Basin. Journal of Applied Meteorology and
Climatology, 52, 341–362.

Tuesday, July 5, 2022

Possible Record Low Great Salt Lake

The Great Salt Lake is expected to set a new historical low elevation at the Saltair Boat Harbor this year and provisional data from the USGS suggests it is pretty close to that level right now.

Below is yesterday's MODIS image from NASA's Aqua satellite showing the large area of exposed playa the northern and southern arms of the lake, including the former Farmington Bay immediately adjacent to Antelope Island and the Salt Lake Valley.  

Observations from the USGS at the Saltair Boat Harbor show that the highest lake elevations since 2007 were achieved in 2013 when the lake was near 4199 feet.  Last year, we bottomed out at 4190.4 feet, which is the record low at this site.  The recovery this spring was limited.  


The latest provisional data since June 1 shows the general downward trend with measurements since July 2 near or below 4190.4 feet, the current record. 


Lake-elevation observations are tricky, so the USGS will need to weigh in on whether or not we are "officially" at the record low, but it appears we are close.  With a few months of decline likely to come, we will easily beat that record by the end of fall and may drop down to near 4189 feet.  

A lot of people ask me about the future of the lake.  In the short term, a best-case scenario would be a return to snowier winters that we have generally seen over the past two decades.  Some temporary recovery would be possible if that occurred. On the other hand, shrinkage will continue if we see the drought persist.  Efforts to increase natural flows to the lake will help slow the shrinkage, but in the long term, I suspect aridification due to climate change will make "saving" the Great Salt Lake as we know it very difficult without importing water.  

Wednesday, April 27, 2022

The Great Salt Finger Lake

Given the meager snowpack that generally exists in northern Utah, it's no surprise that the Great Salt Lake is expected to drop to historically low levels this summer.  

Last year the lake dropped to its lowest measured elevation at Saltair, 4190.4 feet.  A look at the observations collected at Saltair by the UGSS since last year shows that the lake reached its maximum elevation in early May and dropped about 2.5 feet through fall.  

Source: https://waterdata.usgs.gov/ut/nwis/uv/?site_no=10010000&PARAmeter_cd=62614

The recovery during the winter and spring has thus far been pathetic.  We currently sit at about 4191 feet, nearly 2 feet below where we were last year.  The runoff situation isn't great again this spring.  About the only silver lining is that recent storms have helped the snowpack in the Bear River Basin, which is now running ahead of last year by a bit.  


However, that's not going to help a lot and I suspect we'll make a run at 4189 feet by early fall.  

I've been preparing some material on the future of the Great Salt Lake for the 2nd edition of my book Secrets of the Greatest Snow on Earth.  I'll be including a bathymetric map of the lake based on work by Dave Tarboton at Utah State to illustrate what will happen as the lake shrinks.  The deepest portion of the lake lies along a northwest to southeast axis.  As the lake shrinks, it will become increasingly confined to a narrow channel along this axis.  Basically, the Great Salt Lake becomes the Great Salt Finger Lake.  


At about 4170 feet, the lake becomes two salt ponds.  That may sound crazy, but the lake is currently down about 20 feet from its most recent high stand in the late 80s.  Another 20 feet and we are there. 

The Modis image below was taken on September 27, 2021when the lake was near its minimum and historical low elevation.  It corresponds quite well with the 4191 foot contour above with a small arm of water wrapping around the north and east side of Fremont Island and a sliver of water along the Jordan River as it flows through what was formerly Farmington Bay to the east of Antelope Island.  


The implications of the withering Great Salt Lake are more dust, less lake-effect snow, and the demise of one of the most important bird habitats and ecosystems in western North America.  

Thursday, July 22, 2021

The Whithering Great Salt Lake

In the prior post, we examined the causes of the recent drought in southwest North America.  Here we take a look at the Great Salt Lake, a terminal lake with no outlet that fluctuates in elevation and area depending on the water balance of the Great Salt Lake Basin.

New reports in recent days have highlighted that the elevation of the Great Salt Lake is near its historic low.  Measuring the elevation of the Great Salt Lake turns out to be a tricky thing.  Wind pushes water around and since the 1960s the lake has been divided by an earthen railroad causeway, so the north and south arms sometimes have slightly different elevations.  

A news release issued by the USGS on July 16, 2021 indicates that the daily average lake elevation just prior to that news release was 2.4 inches above its historic low and that they expect water levels to continue to decline.  The historical trace from the USGS web site is below and shows current levels near the previous 1963 minimum, so we are certainly close.  

The Great Salt Lake is a remnant of Lake Bonneville.  Geologic evidence suggests that Lake Bonneville began to form 30,000 years ago and at its highest level was over 900 feet deep and covered almost 20,000 square miles.  Much of lowland western Utah was underwater.  

Source: Wikipedia (prepared by Oviatt, C. G., 2019)

Ah, the good old days.

Approximately 18,000 years ago, Lake Bonneville began to spill across what is known today as Red Rock Pass.  Eventually, water burst through the gap and the lake level dropped to what is known today as the Provo shoreline, still well above current lake levels.  However, the water balance shifted after this time and lake levels dropped, with Lake Bonneville reaching something near historical Great Salt Lake levels approximately 13,000 years ago.  A graph showing a reconstruction of lake levels is below, with time indicated based on thousands of radiocarbon years before present (i.e., 20 = approximately 20,000 years before present).

Source: Oviatt (2015)

As indicated in the first graph in this post, records of Great Salt Lake elevation extend back to 1847 when Salt Lake City was settled by Mormon pioneers.  Since then, lake elevation has fluctuated from just under 4192 feet to just over 4211 feet.  These fluctuations also affect lake area and salinity.  Satellite imagery from yesterday well illustrates the current situation.  The lake is confined primarily to Gunnison and Gilbert Bays, the north and south arms of the lake, respectively.  The earthen railroad causeway limits mixing between these two bays, resulting in differences in salinity and halophilic bacteria that lead to the color contrast.  At historical high stand, the Great Salt Lake would cover virtually all of the lighter playa surrounding it.  Evidence suggests that during a prehistoric high around 1700 the lake also covered the playa area further west.  

Source: NASA

The primary inflows of water for the lake are precipitation directly onto the lake and inflows from the Bear, Weber, and Jordan rivers.  The flow in those three rivers is dominated by spring snowmelt, so wintertime precipitation is a primary driver of lake level.  


Since the Great Salt Lake has no outlet, the only way for water to "escape" is evaporation.  Thus, the lake level fluctuates based on differences between the above inflows and evaporation.  

Since the mid 1800s, humans have altered the water balance of the Great Salt Lake directly and indirectly.  The direct effects are related to the capture and use of water along the Bear, Weber, and Jordan rivers for irrigation and other activities.  Indirect effects are associated with climate change.  Recent work led by Utah State University professor Wayne Wurtsbaugh suggests that water diversions since the 19th century have cumulatively lowered the elevation of the Great Salt Lake by approximately 11 feet.  Climate change affects the lake water balance by altering the snowpack, evapotranspiration of ground water in the drainage basin, and rate of evaporation from the lake surface.  These effects are expected to lead to lower average lake levels and may be contributing to recent declines.  I don't know of a study that has explicitly quantified this effect for the Great Salt Lake, although to date I suspect it is much smaller than that associated with water diversion.  

We spoke in the prior post about the slow natural fluctuations in the southwest hydroclimate.  Such fluctuations are a wildcard for the short-term future of the Great Salt Lake.  A swing to a wetter period could temporarily increase lake levels.  A return to the 80s is quite unlikely as tree-ring records indicate that was a very anomalous period, but the lake's trajectory over say the next 10 to 20 years is going to depend a good deal on these slow climate fluctuations.  If drought persists, the Great Salt Lake will continue to whither.  If we swing back to a wetter period, some recovery may occur.

The long term future is less bright without intervention.  Continued water diversion and global warming will further accelerate the decline of the last remnant of Lake Bonneville, with associated collapses of ecosystems and other less desirable effects.