Sunday, January 30, 2022

WYSIWYG Forecast

 The forecast for the next 10 days is pretty depressing and discouraging.  I'll call it a WYSIWYG forecast (What You See Is What You Get).  

As far as the large scale is concerned, there's little change from what we've experienced over the past three weeks.  Ridging off or near the Pacific coast with short-wave troughs rolling over the ridge and diving into Utah.  These troughs bring in some cold air and can partially or fully mix out the air pollution, but are moisture starved, dropping some flurries or an inch or two of snow. 

I'll summarize the situation with the 10-day accumulated precipitation through 0000 UTC 9 February (5 PM MST Tuesday 8 February) from the ECMWF high-res model and the GFS.  The ECMWF puts down a spec of 0.10" of water equivalent for the upper elevations of the central Wasatch for the entire 10-day period. 

The GFS even less.

If we're lucky, perhaps one of the troughs can generate a bit more than predicted by these models, but for the most part, it's looking pretty grim.  This time of year, average precipitation would be more than 2 inches of water equivalent ever 10 days in the upper elevations of the central Wasatch.  

I haven't skied in a couple of weeks due to a nagging ankle injury.  I guess my timing was good for that, although the conversion to couch-potato status is almost complete. 

Also, for those who like to ask about these things, the odds of "Steenburgh Winter" appear to be decreasing with every model run.  If you had asked me during the holidays, I would have likely said it's looking good.  Indeed we reached 97 inches at Alta Collins on December 31st and again on January 6, but have since settled back to 84 inches.  It's a dense 84 inches, but it's not 100.   The Steenburgh Winter equivalent in metric would be 2.5 meters, which would require 99 inches.  Even there we fail!

Thursday, January 27, 2022

A Tough Nor'easter Forecast

In the 1970s and 1980s, numerical weather prediction had reached a point where it was being increasingly used for operational forecasting, but would often fail to predict high impact weather events.  Of particular note were nor'easters, strong extratropical cyclones that develop along the U.S. east coast and can bring crippling snowfall to metropolitan areas.  

A look back at the literature during that time reveals many papers describing forecasts busts.  Lance Bosart wrote an especially important paper on the President's Day Snowstorm of 18-19 February 1979, which affected the mid-Atlantic states.  He noted that "the storm is noteworthy because of the failure of operational prediction models to signal the intensity of the event." 

Source: https://journals.ametsoc.org/view/journals/mwre/109/7/1520-0493_1981_109_1542_tpdsof_2_0_co_2.xml

We've come a long ways since then, but challenges remain today, including the details concerning the track of the system, distribution and intensity of precipitation, and in some storms, the type of precipitation (rain, snow, mixed).  

Below is the GFS forecast for 0000 UTC 30 January showing an intense extratropical marine cyclone off the cost of New England.  This storm has been forecast by our numerical modeling systems for several days now.  It will develop off the southeast and mid-Atlantic coast beginning tomorrow and deepen explosively as it moves northeastward.  It has all the markings of a very dangerous marine cyclone, including a bent-back occluded front (purple front in the image below) that wraps around the low center and features a highly concentrated pressure gradient where strong winds and extreme seas are often found.  

Norwegian meteorologists refer to this region as "the poisonous tail of the bent-back occlusion."  It's a good place to avoid if you're on the high seas!

The challenge in this forecast is the band of precipitation north and west of the system.  Precipitation rates in the center of the band are quite high, but drop off quickly as one moves westward (color fill above is 6-hour accumulated water equivalent precipitation).  Thus, the location is absolutely critical for snowfall prediction as the system moves up the west coast and there are a wide range of possibilities depending on track.  

The latest messaging from the National Weather Service Weather Prediction Center illustrates the probabilities of snowfall in excess of 4 and 8 inches and shows the sharp drop off in the likelihood of such amounts as one moves inland.  


If you live in the mid Atlantic and northeast coastal areas, monitor official forecasts as forecasts evolve and the storm approaches.  

Tuesday, January 25, 2022

Olympic Weather

 If you are an Olympic enthusiast and/or weather junkie and are looking for real-time weather information for the venues, the english version of the Beijing 2022 Weather Portal is available at https://olympic.weather.com.cn/en_dongao/.  


There's a pretty nice display with real-time data for the Yanqing Alpine Center showing station locations with access to wind, temperature, and humidity information.  

As I type this, it's almost midnight in Beijing.  Current temperature at the downhill start is -17.2˚C (1˚F).  


Winds were almost 30 knots as well.  BRUTAL.  Climate is what you expect, weather is what you get, but cold and windy is a very real possibility during these games.  

I've noticed that the time series of observations from the site are frequently old.  It seems to key off of the local time at my location, whereas Beijing is ahead of Utah time.  I've found the best way around this is to change the time in the "to" window to current Beijing time and hit search.  The window reverts back to Utah time, but the time series appears to be up to date.  


That time series shows the high at the start of the downhill yesterday was only about -15˚C it was as cold as -19˚C.  Again, BRUTAL.  

Looking at yesterday at the last 24 hours at the Cross-Country Center, the minimum yesterday morning was -17˚C (1.4˚F) and the maximum yesterday afternoon was -11 (12.2˚F).  However, in the afternoon it was also windy with gusts to over 10 m/s (20 knots).  


Will be interesting to see what the weather brings for the Games.  One thing I didn't see on the site is air quality info.  Hmmm....

Saturday, January 22, 2022

Northern Stau

If you follow ski racing, you know that this Friday and Saturday should each have featured a men's downhill and Sunday a slalom on the famed Hahnenkamm in Kitzbuhel, Austria.  Instead, the meteorologists won the day and the Saturday downhill and Sunday slalom were switched due to anticipated heavy snowfall on Friday night and Saturday.  

Indeed the Saturday snow did materialize and Dave Ryder won Great Britain's first world cup race as he unleashed a great second run and the top skiers from the first run flailed in the difficult conditions.  

Ryder learned to ski on plastic slopes in England and has been knocking at the door for a win for a long time.  Great to see him get his first win at the age of 35, a day after Johan Clarey of France came in 2nd in the downhill at 41.  I believe Clarey is the oldest skier to podium in world-cup history.  

Getting back to meteorology, the snow was produced by a common eastern Alps storm type know as Nord Stau or northern blocking.  These storms occur when there is a high pressure west of the Alps and low pressure to the east, resulting in moist, northerly flow directed towards the Alps.  Often, the flow is stable and the low-level airmass is unable to surmount the massive Alpine barrier.  As a result, the low-level flow is blocked and becomes westerly near the Alps.  This can yield heavy snowfall upstream of the Alpine foothills and terrain near the northern Alpine Rim.  Often there is a dramatic weather near the Alpine Divide, with dry conditions or even clear skies to the south.

This is precisely what happened today.  I've provided a sketch below on the MODIS imagery from midday.  Northerly flow over Germany to the north of the Alps and low-level westerly flow near the Alps, with a transition from cloudy and snowy near and north of the Alpine Divide to clear skies to the south.  

Source: NASA

Evidence for this flow pattern is apparent in the 1200 UTC sounding from Munich, which is about 50 km north of the Alpine foothills.  The low level flow is westerly, but veers to northerly at about 900 mb, or 1000 meters above sea level.  

Source: University of Wyoming

Nord Stau can produce more in the lower terrain near the northern Alpine Rim than on the much higher Alpine Divide to the south.  Below is the 6-hour difference in snow depth analysis for the region for the period ending at 5 AM local time this morning.  Snowfall is clearly greatest near and along the Austrian-German border north of Kitzbuehel where peaks are generally around 1500-2500 meters high.  Snowfall declines to the south along the Alpine Divide where there are many peaks over 3000 meters.  Practically no snow fell south of the Alpine Divide.  

Source: https://avalanche.report/

If you woke up this morning in Innsbruck, you could have elected to ski powder near the northern Alpine Rim or traveled through the Brenner Pass for sunny skies.  Your choice. 

Friday, January 21, 2022

Olympic Weather Preview

The 2022 Olympic Winter Games start on February 4th.  The host city is....Beijing, China?  Weird.  Beijing is not widely known for much related to snow and winter sports.  Does it even get cold there?  Let's take a look.  

Beijing is in east Asia, just inland from the Yellow Sea.  It is about 680 miles from Pyeongchang, South Korea, identified with the thumbnail below and host city for the 2018 Olympic Winter Games.  


As is the case for much of east Asia, the winter climate of the region during winter is dominated by semi-permanent high pressure centered over interior Asia.  

Source: NOAA/NWS Climate Prediction Center

This means the wintertime climate of Beijing is quite dry.  In February, the average precipitation (water equivalent) in Beijing is only 0.19" (1971-2000 normals from https://en.wikipedia.org/wiki/Geography_of_Beijing) compared to 1.30" in Salt Lake City (1991-2020 normals from https://www.weather.gov/wrh/climate?wfo=slc).  I do not have snowfall numbers for Beijing, but if you convert 0.19" of water to snow assuming a generous snow-to-liquid ratio of 15:1 you get a whopping 3 inches.  Beijing is also considerably drier than Pyeongchang, which averages 1.94" of precipitation in February (1991-2020 normals from https://en.wikipedia.org/wiki/Pyeongchang_County).  

You may recall that Pyeongchang cold and windy, at least for many of the outdoor venues.  Beijing is lower than Pyeongchang and thus the average maximum and minimum temperatures for February (41˚F and 22˚F; 1971-2000 normals) are higher than Pyeongchang (33˚F and 14˚F).  I struggled to find more recent climate normals for Beijing and perhaps in the current climate they would be a couple of degrees higher.  For further comparison, the 1991-2020 climate normals for Salt Lake City are 45˚F and 29˚F, so Beijing comes in a bit cooler.

That's all fine and dandy, but the Alpine skiing, Nordic skiing, Snowboarding, Biathalon, and Sliding competitions will held in either the Yanqing or Zhangjiakou Clusters in the mountains north of Beijing.

Source: https://olympic.weather.com.cn/

These are at higher elevations.  Beijing is about 40-60 meters above sea level.  In the Yanqing Cluster, the sliding center is at about 1000 meters and summit of the Haituoshan Mountain is just above 2000 meters.  The Nordic center is at 1700 meters and roughly the same elevation as Soldier Hollow.  

I haven't been able to locate short-term climate data specifically for these venues, but the 1971-2000 climate normals for Zhangjiakou at an elevation of 716 meters include and average high of 35˚F, average low of 14˚F, and average precipitation of 0.16".  The story here once again is exceptional dryness, even in the mountains.  Natural snowfall is scant.  Baring a freak storm, there will be heavy reliance on artificial snow at every outdoor venue.  Odds favor a few flurries or snow showers here or there and not much else. 

The biggest weather-related concerns for the competitions are low temperatures, strong winds, blowing dust, and air pollution.  The latter is strongly related to emissions and I suspect the Chinese will be taking actions to limit those, although I'm not sure they can fully reign in the problem in the Beijing area.  Winds can be strong not only on ridgetops, but even at lower elevations during cold-air surges.  Severe dust storms have occurred in Beijing in February.  

Below is a modis satellite image from February 26th of last year.  The Yellow Sea is evident on the left.  Beijing would be just above the center of the photo. Note the thick pollution in Beijing and the adjoining lowlands and the lack of snow in the mountains to the north where many Olympic events will be held.  The whitespot northeast of Beijing appears to be a frozen lake.  


If we look at the last clear modis overpass on January 19th, there appears to be no natural snow at the Haituoshan Alpine Venue and sliding center.  There may be a skiff of natural snow at the Zhangjiakou Venues, although I wasn't sure I had the location nailed down.  


Artificial snow is increasingly important for winter sports competitions and for some, such as Alpine skiing, natural snow is more trouble than it is worth once the course is prepped.  Additionally, Olympics have been held in cities that don't get a lot of snow (e.g., Vancouver, although snowfall is more plentiful in the adjoining mountains).  Nevertheless, from a weather perspective, this looks to be an Olympics like none before.  

Thursday, January 20, 2022

It's a Trof!


Although it's only a brief flirtation with the storm track, we will see a trough passage tonight and tomorrow, one that will bring a bit of snow for skiing and some wind to clean out the smog that's occupied the valley for far too long.

Tonight, the upper-level trough rolls over the large-scale ridge that is presently off the Pacific coasts and drops into Utah.  At 1200 UTC, the upper-level trough axis is nearly over Salt Lake City.  

For the central Wasatch, expect periods of snow to develop tonight a bit before midnight and continue into tomorrow morning.   There will also be some snow at times in the Salt Lake Valley.  NWS forecasts are calling for a trace to 2 inches of snow in the northern valleys.  

We might do a bit better than that on the east bench, but this doesn't look like a big event for accumulation.  However, we haven't seen snow around here in a while, so heads up for the morning commute.  

For the central Wasatch, our GFS-derived Little Cottonwood forecast is putting out a miserly 0.32" of water and 5" of snow through Friday afternoon.  


This is very close to the mean from the Short Range Ensemble Forecast System (SREF).  And, if you look at the accuulated snow plume, 19 of the 26 members are between about 5 and 7 inches.  Three are under five and 4 are above 8, but most are locked in around those dust-on-curst amounts.


Thus, I like 4-8 inches for Alta-Collins with most of that falling before 1500 UTC (8 AM MST) tomorrow morning with a few snow showers beyond that.  It's not much, but beggars can't be choosers.  

As the trough moves southward, it amplifies and closes off over southern Utah and Northern Nevada Arizona later tomorrow.  


This results in easterly flow across the Wasatch Crest, with downslope winds (known locally as Canyon winds) possible tomorrow night and Saturday morning.  Right now, this doesn't look like an extreme event, but monitor forecasts.  At least it should ensure that if the trough passage itself doesn't crack the inversion and mix out the pollution, the enhanced flow should the job.  

Sadly, this is not the pattern change we've been looking for.  Jedi mind tricks sadly won't change that.  The pattern through the next work week continues to advertise below average snowfall with are best hope being troughs that roll through the ridge.  After that we will see.  It's time to start burning skis again.  

Tuesday, January 18, 2022

Don't Breathe

Air quality over the past three days has deteriorated as pollution has built up in the valleys and basins of northern Utah.  Below are time series of PM2.5 (top) and wind direction, speed, and gust (bottom) from the University of Utah.  PM2.5 concentrations at this site tend to fluctuate daily and are typically lower at night when there is easterly to northeasterly outflow from Red Butte Canyon and higher in the afternoon when there is westerly to southwesterly upslope flow from the Salt Lake City metropolitan area.  You can see these swings very clearly below, with peaks in PM2.5 in the afternoon and valleys at night.  

You can also see that the weak trough passage on Friday did provide some ventilation of the valley with PM2.5 concentrations on Saturday afternoon considerably lower than on Friday afternoon.  

However, that was only a partial mix out and since then we have seen PM2.5 concentrations rise each day.  Yesterday afternoon, we peaked at 63 ug/m3, well above the threshold for unhealthy for sensitive groups of 35.5 ug/m3.  

While the area around the University of Utah sometimes gets a nighttime flushing out, that's not the case on the valley floor.  Additionally, Friday's weak trough put less of a dent in the pollution at those lower elevations.  Below are PM2.5 estimates from the PurpleAir site at the West Valley city Public Works.  Except for some brief dips into moderate (yellow), PM2.5 has been consistently in or above unhealthy for sensitive groups. 

Source: PurpleAir.com

Finally, we can also look up Parley's Canyon.  The observing sites at Mountain Dell have shown  daily fluctuations.  Clean air at night and in the morning, then a big increase in the afternoon as up-canyon flow transports the urban plume from the Salt Lake Valley.  Yesterday in particular saw a huge spike to unhealthy levels.  Best to skate ski in the morning.  

Source: PurpleAir.com

We're stuck with this through at least Thursday.  A trough moving over the ridge Thursday night and Friday may stir things up a bit and possibly bring a little snow too.  Let's hope it does as we need it.  

Monday, January 17, 2022

Surface Hoar

If you are out and about in the backcountry this weekend, you may encounter surface hoar, beautiful but weak ice crystals that form on the snow surface when it cools below the frost point.  We saw plenty of it yesterday at lower elevations during our ski tour.  

Surface hoar is sometimes described as recrystallized powder, but as I understand it, that's incorrect.  Surface hoar is created through the growth of new crystals.  The formation process is similar to frost.  The snow surface cools below the frost point and ice crystals grow from the deposition of atmospheric water vapor onto the snow surface.  This process becomes highly effective under clear skies, when the snow surface can become quite cold, and when there is a strong temperature inversion.  It is also very effective near open water where there is a source of water vapor.  

In contrast, recrystallized powder, or near-surface facets, form through the metamorphism of existing snow crystals.  Near-surface facets are typically smaller than surface hoar crystals.  They form in the upper portion of the snowpack when strong temperature gradients exist near the snow surface (see Recycled Powder and Other Types of Near-Surface Faceting by Karl Birkeland).  There are several pathways for near-surface facets to form, including situations not favoring surface-hoar formation.  

Regardless, either surface hoar or near-surface facets can be your next weak layer.  The surface hoar we skied through yesterday was thin and fragile, shattering like shards of glass as we skied through it.  Not exactly bedrock to serve as the foundation for a stable snowpack.  Near-surface facets are also weak.  Beautiful today, but potentially scary tomorrow.  

Saturday, January 15, 2022

Snatching Defeat from the Jaws of Victory

How to describe forecasts for the next 14 days?  Awful?  Dismal? Pathetic?

It's not impossible that some trough sneaks through the grips of the high-amplitude ridge and gives us a few flakes, but for the most part, it looks like a lock that we're going to see well-below average precipitation and mountain snowfall over the next two weeks.  

On average this time of year we should be getting about 3.5 inches of water equivalent and 40 inches of snow at Alta every two weeks.  We'll be lucky to get 0.5 and 5 and if the majority of models are right, we'll get close to nothing.  

Here's an example, the Euro over the next 10 days.  No precipitation in the central Wasatch. 

Source: Pivotal Weather

And how about the CPC 8-14 day outlook.

Source: CPC

A good forecast if you're into valley pollution and hate snow.  For the rest of us, it sucks.

Below is the mean water equivalent in the Jordan River Basin (including the central Wasatch) based on SNOTEL stations.  Note that we've plateaued at 10.2". Unless forecasts change dramatically, we're probably going to be back at or below median by January 25th.  

Source: NRCS

Basically, Mother Nature is snatching defeat from the jaws of victory for this snow season.  January should not be like this.  It should be cold and we should be skiing powder.  Instead, the next couple of weeks will probably be a net loss for the lower elevations, especially in sun exposed areas, and perhaps even at mid-to-upper elevations on the south side of the compass.  

Sigh...

Friday, January 14, 2022

Can You Really Do Your Own Research?


The Internet is a blessing and a curse.  So much information at your fingertips.  But alas, interpreting studies is fraught with perils and there's also a lot of misinformation out there.  In fact, there's plenty of snake-oil salespeople, some of them highly trained, making good money on uncertainty and misinformation.  Even amongst ethical scientists, the value and applicability of papers published in the peer reviewed literature varies.  If you want to get to the bottom of critical issues, from COVID to climate change, can you do it?  

I personally am skeptical of the ability of most people to ignore expert guidance, sift through data and publications on complex matters, and figure it out for themselves.  This is not to put experts on a pedestal, but instead to recognize the realities and complexities of interpreting data and scientific studies, as well as our vulnerability to cognitive biases. 

The reality is that it takes time, practice, and experience to build the skills to identify, evaluate, and synthesize research results.  After 30+ years in research, I'm pretty good at finding, evaluating, and applying scientific knowledge within my specialty area, but I still spend hours sometimes digesting the findings and implications of research articles in order to prepare a paragraph for an introduction for one of my papers or to better interpret my research results.  

Some of my knowledge is transferable to other fields or applications.  Knowledge of math, statistics, and physics, for example, is somewhat transferable.  However, such knowledge can also be a trap.  Lies, damned lies, and statistics right?  Well, subject-matter expertise is very important for understanding the strengths and weaknesses of the datasets used in statistical analyses and the interpretation of results.  When my research requires me to cross into other fields, I have found it very useful to consult with people who work in those fields.

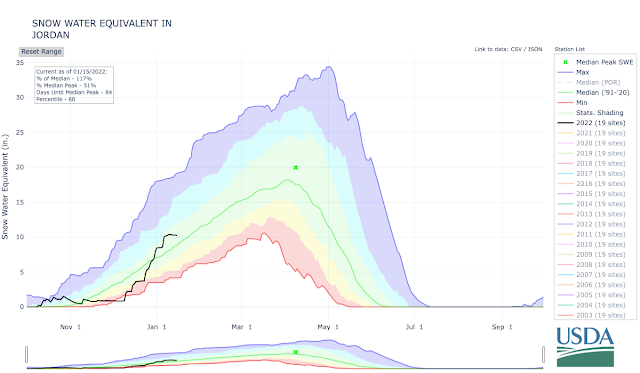
One example is trends in snowpack measures.  I am not a snow hydrologist, but I often work with snowpack observations (including for this blog!).  Trends in snowpack water equivalent are pretty easy to calculate, but if you find that snowpack has declined substantially more rapidly on mountain A compared to mountain B, is that a sign of some sort of climate-driven shift in microclimate?  Perhaps, but if you talk with a snow hydrologist, especially one who collects snowpack observations, you learn that there are other possible causes, including changes in vegetation and tree canopy, human disturbance (e.g., snowmobiles), etc.  

Experts of course make plenty of mistakes and like everyone else are vulnerable to cognitive biases.  They can also be unethical, manufacturing data or falsifying results. The scientific method, peer review, and efforts to reproduce results are approaches for minimizing these problems.  Additionally, panels, boards, and other group approaches can be used to reduce the influence of individual bias.  There's also less formal checks and balances.  I've benefited throughout my career from good friends who have "called BS" or challenged my analysis methods or interpretations when my personal cognitive biases were causing me to cut corners or misinterpret results.  

One thing that I notice quite a bit in social media is that we are suckers for a good story.  I see this frequently with climate change.  Someone passionately claims on social media or at one of my talks that "it's the sun" that has caused global warming. All scientists have ever done is talk about CO2.  We've overlooked the most important climate driver of all!

YES!  Decades of climate research by thousands of scientists and nobody ever thought of that!  Lol.  Such a good story, but of course untrue (see https://skepticalscience.com/solar-activity-sunspots-global-warming.htm for one reason why).  I can provide more and more examples.  Cosmic rays are causing climate change.  Global warming has stoped.  Antarctica is gaining ice.  It goes on and on and on.  

You may accept climate change and think you wouldn't fall for those arguments, but we all suffer from cognitive bias.  I get fooled often.  Did you see this one?


Pretty good story.  I fell for it hook, line, and sinker, except it was apparently 20 eagles tracked for a year rather than one tracked for one year.  I'm not even sure the latter is real at this point.  Perhaps your BS filter is stronger than mine and if so, good for you!  

As you do your own research, be cognizant that there may be more to the story.  Sometimes what appears logical is really illogical.

Thursday, January 13, 2022

Locked, Not Loaded

The upper-level pattern is locked in for the for the foreseeable future.

Below is a 12-day loop of GFS analyses and forecasts from 1200 UTC (5 AM MST Tuesday) 11 January through 1200 UTC (5 AM MST Sunday) 23 January.  Color fill is the wind speed at jet-stream level (250 mb).  The Pacific jet is raging, extending from Asia across the western and central Pacific.  Apologies for not including a color scale, but at times maximum winds along the jet core locally exceed 200 knots.  What a beast.  

However, the jet splits near through this period near Hawaii.  There are some variations in the extension of the jet, but for the most part, Intermountain West is left under a ridge or split flow with just some synoptic debris, or weak troughs floating around.  These are the leftovers spit out from the exit of the Pacific Jet. 

Let's take a look at some ensemble forecasts.  Below is the mean 500-mb geopotential height forecast from the Global Ensemble Forecast System valid 0000 UTC 20 January.  The upper-level flow generally parallels these contours and is strongest where the contours are close together.  Here you see a deep trough over the north Pacific, the raging Pacific Jet, ridge over the west coast of North America, deep trough over eastern North America, and ridge over the North Atlantic.  Commit that to memory.

Source: NOAA/ESRL/PSD

Same, but for 0000 UTC 23 January.  Same pattern, but more amplified.  

Source: NOAA/ESRL/PSD

Same, but for 0000 UTC 28 January.  A little flow here cutting under the ridge over the western U.S.  Otherwise not much change.  

Basically, the pattern is locked, but for Utah not loaded.  The upper-level/jet stream pattern is very high amplitude with persistent upper-level troughs and ridges remaining relatively stationary.  For snow, we have to hope for an upstream shift in the upper-level ridge so that some of the storms moving over it can drop down into our area or for the southern branch of the split jet to get more active and extend into our region.  There's also the hope that the models are wrong.  There's always hope.  

Right now, it looks like the odds are stacked for below-average snowfall for the next 14 days.  Worst case scenario is little to no snow.  Best case scenario is something can slip through the net as described above and we get a couple of modest storms.  Tonight and early tomorrow we have one of those troughs that moves over the ridge, but the moisture is scant and too far north, so other than some flurries in the mountains, we won't see much, although it will fortunately stir up the inversion and the pollution, although it's not clear if we will see a full or partial mix out.  Hoping for the former, but will take the latter.  Beggars can't be choosers.  

Wednesday, January 12, 2022

Daily Cycles in Air Quality

The air quality has fluctuated dramatically at the University of Utah, on the east bench in general, and in Parley's canyon over the last two days.  

PM2.5 observations from our mountain meteorology lab site at the mouth of Red Butte Canyon show low concentrations, indicative of good air quality, through the morning of 10 January (Monday).  On Monday, the inversion and the pollution began to build.  PM2.5 concentrations peaked at about 11 ug/m3, at the upper end of good.  

Source: Mesowest

However, they then dropped in the evening, with a couple of brief spikes to higher values.  On the morning of 11 January (Tuesday) they then climbed again, this time reaching higher values and topping out at 27 ug/m3, solidly in moderate.  Then they dropped overnight again.  

These observations reflect both a trend and a daily cycle.  The trend is the buildup of pollution in the Salt Lake Valley as emissions continue to pour into the persistent valley cold pool.  The second is the daily cycle of airflow along the east bench, with cleaner easterlies developing in the evening and at night and dirty westerlies developing during the day.  

Below is the corresponding time series of wind speed and direction at the mountain meteorology lab.  Wind direction is the blue dots.  Note the tendency for west to southwest (W-SW) flow during the day and east to northeast (E-NE) flow at night.  The PM2.5 cycle in this event lags the shift between these regimes somewhat, rising slightly after the shift to W-SW and decreasing after slightly after the shift to E-NE, which reflects the time for transport to either bring in the dirty or clean air.  

Source: Mesowest

If you look carefully, you can even see that the PM2.5 spikes at night are related to brief shifts in the wind or calm periods.  

A similar trend and cycle can be seen even at Mountain Dell up in Parley's Canyon.  During the day, the polluted urban airmass is transported up the canyon, leading to an increase in PM2.5, only to be replaced by cleaner air at night.  

Source: purpleair.com

Think of this as a sloshing of the valley cold pool and concomitant pollution if you like, and a reflection of what meteorologists call thermally forced flows.  Such flows are produced by heating and cooling of sloping land surfaces and the influence of the Great Salt Lake, which warms more slowly during the day and cools more slowly at night.  So far in this event, this has led to lower PM2.5 concentrations on the east bench in the morning than over the West Valley, as illustrated by this morning's purpleair.com observations.

Source: purpleair.com.  Obtained 7:47 AM MST 12 January 2021

Although not all wintertime pollution periods feature these characteristics.  In some cases, the inversion capping the valley cold pool is more elevated, and the clean air does not flush the east bench each night.  In others, the cold pool is shallow and the highest elevations of the east bench and stay clear all day.  Nevertheless, such cycles are not unusual during air pollution events and they are worth keeping an eye out for if you are looking for clean air for exercise.  

Tuesday, January 11, 2022

Pathetic Forecast

Pretty pathetic forecast covering at least the next 10 days or so.  Essentially a flatline for mountain and valley precipitation in some models.  Shall we start with the ECMWF for a change of pace?  Total accumulated precipitation in the central Wasatch a big goose egg over the next ten days, with just a skiff of snow in the western Uintas and Bear River Range.  

Source: Pivotal Weather

GFS?  How about a tad over a trace for the Wasatch Crest.

Source: Pivotal Weather

Cutting back to 7 days for our NAEFS ensemble product, there are 7 members (out of 52) that generate 4-9 inches of snow, mainly from a weak trough that rolls over the ridge and affects Utah late Thursday and Friday.  The rest of the members are 0-3 inches of snow.  


About the only positive is that trough later this week comes close enough to stir up the inversion and mix out the pollution.  The GFS forecast below valid 0600 UTC 14 January (11 PM Thursday) shows decently strong northwesterly flow at 700-mb and temperatures that will probably be just cold enough to mix things out.  


At least that's something.  


Wednesday, January 5, 2022

Messy Day Ahead

As anticipated in Monday's post, a messy storm has arrived in northern Utah.  

Let's start with the big picture.  The 6-hour GFS forecast valid at 1200 UTC (5 AM MST) this morning shows high integrated water-vapor transport (IVT) values associated with an atmospheric river curving anticyclonically (clockwise) from near Hawaii over a high-pressure system off the coast of California and across Oregon and Idaho towards Utah.  

Source: CW3E

A closeup for the western U.S. shows atmospheric river conditions extending into northern Utah.  

Source: CW3E

This pathway across Oregon and southern Idaho is one of two key ones for atmospheric river penetration into northern Utah as it minimizes water vapor loses to precipitation over high barriers such as the Sierra Nevada.  The other key pathway comes up the lower Colorado River Valley and through western Utah.  

This morning's 1200 UTC (5 AM MST) sounding from the Salt Lake City airport shows saturated conditions near and above 700 mb (about 10,000 feet), but drier air below that level,  Thus, moisture transport has come in aloft over the drier air that was resident over the Salt Lake Valley and Great Salt Lake Basin.  

This is consistent with the view looking south from the University of Utah this morning which shows layered clouds based at about 9000 or 10000 feet above sea level.  Note also the transition from west (right) to east (left) with the mountains becoming obscured, a tell-tale sign of orographic precipitation enhancement as the flow moves over the mountain barrier.  


Indeed, radar imagery at 14:58 UTC (7:58 MST) shows weak or no returns over the western Salt Lake Valley, but stronger returns over the east bench and especially over the western Cottonwoods. 


From 5-8 AM MST this morning, Alta-Collins recorded 0.68" of water equivalent and about 4" of dense snow.  Total water and snowfall since yesterday are 0.93" and 6" respectively.  It's running around 35˚F at Mountain Dell (5700 ft), so the snow level is probably at or around 5500-6000 feet, although it will fluctuate some with precipitation intensity.  At the University of Utah at 7:30 AM it was raining with the occasional flake mixed in.  

The models promise much of the same through the day and at least into the early evening tonight, although precipitation rates will probably modulate some.  Precipitation rates will slacken later tonight with the storm winding down tomorrow.  Temperatures and snow levels may bounce around a bit today, but the long-term trend is upward.  

The GFS is running a bit behind the water and snowfall totals at Alta-Collins, but ultimately generates a storm total of 2" of water and 19" of snow through 11 AM tomorrow, most of that coming through about 2 AM tonight.  


Those numbers are near the mean for the downscaled short-range ensemble forecast system (SREF), but a bit more than double the European model.  Another 1-1.75" of water and 8-16" of high-density snow seems likely for the upper-elevations of Little Cottonwood through tomorrow.  Did I mention the wind?  That will be high as well.  

Monday, January 3, 2022

Messy Weak Ahead

It was a great run during the holidays for northern Utah.  From December 22 to January 1, Alta recorded 70 inches of snow.  All resorts and backcountry areas benefited, as did the Nordic skiing.  Mountain Dell has great cover heading into 2022.  

Then, the sun came out in the Cottonwoods over the weekend and it was nice to see it.  Yesterday was spectacular in the backcountry, with amazing conditions.  


I exit the holiday week tired but happy.  I can't remember the last day I didn't ski tour or skate ski!

The week ahead promises some snow, but it looks messy.  I'll summarize in three parts.  

First is tomorrow when we are in predominantly zonal (westerly) flow at the tip of a decaying inland-penetrating atmospheric river.  Expect some snow to develop during the day, especially in the northern Mountains.  

Second is late Tuesday night and Wednesday when a weak trough passes through, driving what will probably be the snowiest period of the week.  


Third is moist northwesterly flow that persists in the wake of the trough through Thursday morning.   


The models differ on some critical elements of the forecast, especially in the wake of the trough on Wednesday and Thursday.  The GFS is fairly warm, increasing the 700-mb temperatures to around -4˚C by 5 AM Thursday, whereas the European and NAM are quite a big cooler and go for -8˚C and -7˚C respectively.  Where we end up in this temperature spectrum will play a bit role in the later stages of this storm and whether or not we see a transition to rain in the lower elevations, or cling to snow until later in the event.  It will also affect snow quality at upper elevations.  

Below is the GFS-derived forecast for upper Little Cottonwood.  Keep in mind that this is one of the warmer forecasts.  There are some dribs and drabs on Tuesday, but things really pick up late Tuesday night and Wednesday with the passage of the trough.  Through Thursday morning, the GFS generates almost 2 inches of water and just over 20" of high-density snow.  


Note also that the temperatures on Mt. Baldy rise through the period, as does the wet-bulb zero level, and it is pretty windy.  During the period of heaviest precipitation, the snow-to-liquid ratio decreases. 

The GFS warms faster than the other models, but with the wind and the overall synoptic setup, this will probably be a period of higher density snow and possibly some upside-down skiing conditions, especially in the backcountry.  In other words, messy.  

Still, it's snow, and we'll take it.