Showing posts with label Flooding. Show all posts

Thursday, October 9, 2025

Rocktober Is Coming

Wow, what a forecast.  Buckle up as a lot is going to be happening through Sunday.  Things get exciting around here when the mid-latitude storm track phases with monsoon moisture and we will have both in spades this weekend.  

I'll start with the GFS forecast valid 1200 UTC 11 October (0600 MDT Saturday).  A deep trough sits along the Pacific coast and monsoon moisture is streaming into the four corners area, producing the Predecessor Rain Event (PRE) discussed the the previous post in advance of the remnants of Hurricane Priscilla over northern Arizona, southeast Utah, and southwest Colorado.  In addition, a strong cold front sits over eastern Nevada.


By 0000 UTC 12 October (1800 MDT Saturday) that strong cold front is over northern Utah and lighting up parts of northwest Utah.  


I'm not sure how Saturday is going to play out in the Salt Lake Valley ahead of the front.  There will be southwest flow ahead of the front but it's hard to say if we might get showers and thunderstorms from the monsoon moisture or if we might be "dry slotted" in an area of dry air that has wrapped round the trough.  We shall see.

By 0300 UTC 12 October (2100 MDT Saturday), the front is pushing across the Salt Lake Valley bringing rain and possibly thunderstorms.  This is a strong front and a deep trough, expect a big change overnight.  


By 1200 UTC 12 October (0600 MDT Sunday) we are post-frontal, with unstable northwesterly flow.  700-mb (crest-level temps) at this time are -5.6°C, compared to 6.8°C just 12-hours earlier on Saturday afternoon.  Snow levels will be a dropping with the front.  

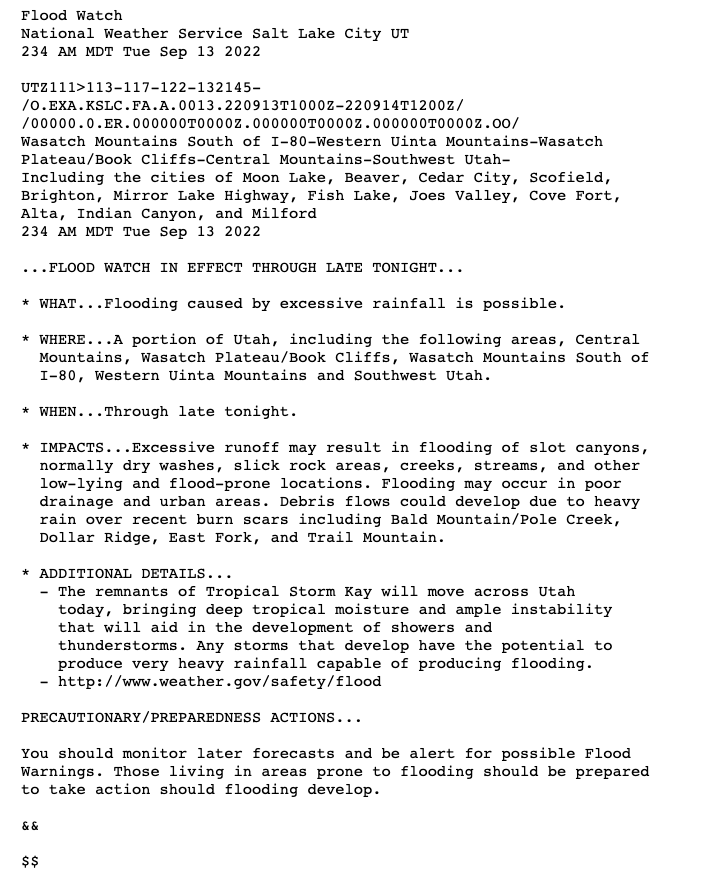
Expect some adjustments in timing and details as the event approaches and consult forecasts, not only for the Salt Lake area, but especially if you are adventuring in southern Utah over the next few days.  The NWS currently has a flood watch up for that area starting this afternoon.  

Source: NWS; Snapshot from 1:06 PM MDT 9 Oct 2025

More mountain snow in the central Wasatch?  You betcha'.  Snow levels will be high Saturday, but they will be crashing down Saturday night if the forecast frontal timing is accurate.  Accumulations will depend strongly on how much precipitation falls during and after the frontal passage.  Through 0000 UTC 13 October (1800 MDT Sunday), the median downscaled GEFS and European ensembles are generating about 1.5" of water, but the former is around only 4" of snow whereas the latter is closer to 7".  Much is going to depend on details that are tough to anticipate now.  Stay tuned.


I'll add that median wet-bulb zero levels drop to as low as 6600 feet on Sunday morning.  It's not out of the realm of possibility to see some flakes down to bench levels.  

Buckle up.

Tuesday, October 7, 2025

Potential Southwest Gullywasher

A lot of exciting things can happen this time of year when the mid-latitude storm track interacts with monsoon moisture.  The latest model runs really get my attention in this regard as they are putting out a good deal of precipitation in the southwest US.

The latest GFS shows the precipitation picking up in northern Arizona on Thursday.  By 1200 UTC 10 OCT (0600 MDT Friday), precipitation is organized in a band that runs from SW to NE from northern Arizona and to western Colorado. 


This precipitation region is to the north and northeast of Hurricane Priscilla, which is forecast to be off the coast of Baja California at that time.  Such a precipitation feature is sometimes referred to as a Predecessor Rain Event, or PRE and occurs as enhanced vapor transport north of a hurricane experiences large-scale lift.  Forecast soundings from Flagstaff at that time are saturated with precipitable water values of 25.4 mm (exactly 1 inch if you prefer US units), which is quite high for early October.  

The precise track of Priscilla is still unclear, but the latest GFS has her decaying off the coast of Baja at 1200 UTC 11 Oct (0600 MDT Saturday) with a plume of integrated vapor transport exceeding 500 kg/m/s extending into northern Arizona.  


That's impressively high IVT given the elevation of that region.  The GFS also continues to produce heavy precipitation in the same banded region.  

Total accumulated precipitation produced by the GFS exceeds 2 inches in a band that runs from just west of Flagstaff through SE UT and into SW CO.  Precipitation maxima produced by the GFS along this band exceed 3 inches, and this is a model that cannot resolve fine-scale precipitation features like thunderstorms.

Source: Tropical Tidbits

The ECMWF has a somewhat different idea about Priscilla's track and brings her through southeast Arizona.  That smears the precipitation out more across the four-corners area and gives heavy precipitaiton to southeast Arizona and southwest New Mexico.

Source: Tropical Tidbits

This has all the hallmarks of a late-monsoon, high-impact event for the southwest with heavy precipitation and flooding.  

Saturday, August 19, 2023

Hilary Update

It's just after noon on Saturday with a very eventful 60 hours or so on tap for SoCal, Nevada, and possibly portions of adjoining states due to one of the more significant tropical cyclone events in recent memory for the southwest US.  

According to the latest (12 PM MDT Saturday August 19), Hurricane Hilary is currently a category 3 hurricane with 115 mph winds.  Satellite imagery showed the circulation center of Hilary just west of the southern tip of Baja California with high clouds extending northward across Baja, SoCal, Nevada, and even northern Utah.  

Source: College of DuPage

Beneath those high clouds is a predecessor monsoon surge that is working its way up the lower Colorado River Valley and environs.  Radar imagery at 1200 MDT (1800 UTC) Saturday showed showers and thunderstorms in southwest Arizona and southeast California. The heaviest were near and within an area with precipitable water values at or above 50 mm (2 inches).  

Precipitable water is a measure of the total integrated water vapor content of the atmosphere with height, expressed as a depth if the vapor were condense.  Values in excess of 60 mm (2.35 inches) are very close to Yuma where upper-air sounding records extend back to 1955 and the highest observed is 2.33 inches.  

This is a juicy airmass and it is going to get juicier!

The National Hurricane Center calls for Hilary to track northward across northern Baja, SoCal, and central Nevada.  Winds are expected to weaken to tropical storm strength when it crosses into SoCal and then further as it moves into Nevada, but most of the impacts will be due to precipitation and flooding.

Source: NHC, Issued 12 PM MDT Aug 19, 2023

Thus, don't be fooled by language like Hilary being downgraded or weakening.  That pertains solely to the strength of the maximum sustained winds.  The potential for serious flooding and even some wind damage in some areas remains.  

To the former, check out the GFS total accumulated precipitation forecast from 1200 UTC 19 August (this morning) through 0000 UTC 22 August (6 PM MDT Sunday).  More than 2 inches with locally greater accumulations across portions of SoCal and south-central Nevada and local accumulations around 5 inches. 

Source: TropicalTidbits

And these are remarkably dry areas.  The GFS is putting out 4" for Death Valley, for example, which averages 2.24" a year.

The HRRR isn't quite as excited, but is still generating widespread 1-2.5+" for much of SoCal into south-central Nevada. A few high elevation areas are well over 5".

I plucked out the HRRR forecast for near Furnace Creek and it's just over 2.5".


And for Mount San Jacinto west of Palm Springs its 12.5+ inches, I think.  I say I think because my code wasn't design to handle these outrageous totals so things are being plotted completely off scale.


The NWS forecast is for 5-7" in the Mount San Jacinto area, but also enormous totals of 4-5" in Palm Springs which is approaching their average annual precipitation of about 5.5".  

Source: NWS; Issued 4:33 AM PDT 19 August

This storm will come hard and fast.  I don't really have an analog in my mind for it.  It's probably good the storm is moving rapidly so that the intense precipitation doesn't linger for another day or two.

Friday, August 4, 2023

After the Deluge

Yesterday brought another day of heavy monsoon convection to northern Utah.  The National Weather Service 24-hour precipitation analysis for the period ending at 1200 UTC 4 August (6 AM MDT Friday) shows totals in northern Utah reaching over 5 inches in the area north of Brigham City.  


An observing site near Honeyville near that maximum reported a 48-hour total of 5.83".  There is some concern about the veracity of that sensor, so this will need to be verified, but other stations in that area reported over three inches.  

Meanwhile a bit further south, convection moved across the southern Salt Lake Valley and northern Utah County yesterday evening.  The storms produced a remarkable amount of lightning.  
The analysis above indicates maximum accumulations of between 1.5 and 2 inches, although there is one pixel that may be above 2.  A closeup of radar estimated precipitation in the Corner Canyon area shows estimates over 1.8 inches in an hour.  


Draper Mayor Troy Walker declared a state of emergency due to flooding and damaged roads.  The storm intensity was similar to the one that hit the Sugarhouse in July 2017 and put down about 2.28" in 60 minutes (see Another Look at the Deluge...although this was a different deluge!).  It was a monsoon storm producing heavy precipitation in a highly localized area overwhelming the human-built system.  Hopefully the damage is limited.

Tuesday, July 11, 2023

Northeast Deluge

Chances are you've seen some of the footage of the remarkable flooding in the northeast the past couple of days.  

We will focus here on the Adirondack Mountains of New York and the Green Mountains of Vermont.  The National Weather Service Burlington Forecast Office produced a map earlier today of the storm total precipitation for their forecast area, which extends across northern New York.  The event featured impressive enhancement over the Green Mountains and portions of the Adirondacks.  In the case of the Greens, a broad area of more than 5" fell including more than 9" in Plymouth just to the south of Killington along Route 100.  In the Adirondacks, more than 5" fell in Newcomb.  

Flooding, mudslides, and washed out roads have occurred in many areas.  Below is drone footage from yesterday in Montpelier, which was posted by The Weather Channel.

Extensive damage is also being reported in the Long Lake, Blue Mountain Lake, and Newcomb area of the Adirondacks.  I've traveled through this area hundreds of times (that's not an exaggeration).  So hard to see.  

Thursday, April 13, 2023

Hot and Dusty with Avalanches and Flooding

These are eventful times, and there is much to talk about today.

First let's talk about the temperatures.  The monster swing over the past 10 days or so is well illustrated by the graphic below which is produced by the National Weather Service Forecast Office in Salt Lake City.  It shows the range of average temperatures (1991-2020) in green, record highs (top of red), and record lows (bottom of blues).  The range of observed temperatures each day are the dark blue bars.  On April 4th, the high temperature was only 33˚F.  By April 11th, it was 83˚F, a record high for the date. 

Source: NWS

Yesterday was a touch cooler, although we still hit 78˚F, marking three days in a row above 70˚F and five days in a row above 60˚F.

As readers of this blog are well aware, this led to elevated avalanche hazard as we transitioned from dry to wet avalanches, a prolonged closure of Little Cottonwood Canyon, and regular afternoon closures of Big Cottonwood Canyon.  

My view is it's been too hot to ski tour, so I've been perfectly happy down in the valley dreaming of cool nights and warm (not hot) days for a good corn cycle.

Unfortunately, there is a fly in the ointment for that and that is the dust that was blown into the area yesterday.  Observations from the University of Utah snowed elevated PM2.5 levels, peaking at around 25 ug/m3 during the day yesterday. 

Source: MesoWest

This dust was kicked up and transported to the area by the strong southerly and southwesterly flow.  I had hoped that with such a wet season, we might escape without such dust, but alas, that's not to be. 

Finally, there was localized flooding in several areas of northern Utah yesterday.  In Salt Lake City, water was spilling out of the Emigration Creek fed Wasatch Hollow area and onto surface streets near 1700 East and 1700 South.  Much thanks to volunteers working to sandbag the area. 


The hydrograph for Emigration Creek, taken near Hogle Zoo, shows the flow peaking above flood stage at 155 cfs.  If the data I obtained from the NWS site is correct, the peak flow at this site is 164 cfs on May 13, 1984. 

Source: NWS/CBRFC

1984 is not a typo.  As much attention as 1983 gets because of the iconic photos of water flowing down State Street, 1984 was also a monster snowpack and runoff year.  At the Parley's Summit SNOTEL, for example, peak water equivalent in 1984 (blue line) exceeded that in 1983 (brown).  This year (black line) the peak was just above 1984.

Source: USDA

The good news is that we are cooling off today, and the expectations are for the flows on Emigration Creek, after dropping overnight, to continue to drop today.

Tuesday, September 13, 2022

Prelude of Petrichor

I woke up this morning to the smell of rain, or what is known as petrichor.  The UK met office has a nice web page explaining the origins of the word and what causes the smell.  It says,

"Raindrops landing on dusty or clay soils trap tiny air bubbles on the surface which then shoot upward — as in a glass of Champagne — and burst out of the drop throwing aerosols of scent into the air where they are then distributed by the wind."

Radar imagery at 1402 UTC (8:02 AM MDT) showed showers over portions of northern Utah, some likely heavy, especially in the West Desert. 

I'm quite glad to see this as although we had an active monsoon for part of the summer, the last couple of weeks have been hot and bone dry.  On the other hand, there are concerns about flooding produced by heavier downpours.  

The HRRR suggests that in the Salt Lake Valley we may see more isolated to scattered showers for a time today before things pick up again in the afternoon.  We'll see if that plays out.  Below is the forecast for 2100 UTC (3 PM MDT) this afternoon when the next area of heavier precipitation with embedded cells is moving north-northeastward through the Salt Lake Valley.  

Although we can't count on the details of a forecast like this verifying given the chaotic nature of convective showers and thunderstorms, keep an eye to the sky today as there's a pretty good chance you're going to see something.  The NWS has issued a flood watch for some areas of northern Utah, which I've reposted below.  

Friday, August 26, 2022

The Moab Flood

Brian Schott has an excellent article discussing the Moab flood and some of the problems with the use of phrases like "100 year event" that was published yesterday in the Salt Lake Tribune.  In it, Moab's city engineer, Chuck Williams, does a good job describing some of the concerns about that phrasing and also how prior rainfall set the stage for the event by saturating soils (where they exist in that red rock country).  

I'll talk a little here about the precipitation piece of the puzzle.  Below is the  National Severe Storms Laboratory's Multi-Radar Multi-Sensor (MRMS) system 1-hour accumulated precipitation estimate for the period ending at 1:50 UTC 21 August, or 7:50 PM MDT 20 August.  Based on my visual inspection, this was the 1-hour period with the greatest coverage and intensity of precipitation in the Moab area.  Precipitation is heaviest along US-191 and in the Behind the Rocks area to the west, with pixel-level values maximizing at about 1.4 inches.  To the east, in the Mill Creek basin, amounts vary from about .6 to 1.2 inches depending on location.

Source: https://mrms.nssl.noaa.gov/qvs/product_viewer/

I also took a look at shorter-time-scale precipitation estimates.  Radar-estimated precipitation at one location peaked at about 0.7 inches for a 15 minute period (note: this is one pixel, not the entire area).  Based on the Salt Lake Tribune article, the NWS received a report of nearly an inch in 20 minutes, so these are fairly close. 

Now if we were to look at the so-called recurrence interval for such precip amounts in the Moab area, 0.7 inches in 15 minutes has a recurrence interval of about 50 years and 1.4 inches in an hour about 100 years.  That sounds like a rare event.  However, these recurrence intervals have many problems, some discussed in the Tribune article linked above, but one not mentioned is that for precipitation, they are for a point.  During the monsoon we basically have thunderstorms dropping heavy precipitation in highly localized areas.  The odds that a specific location gets 0.7 inches of rain in 15 minutes is pretty low.  The odds that it happens somewhere in southern Utah is, however, much higher, and this is especially true during an active monsoon season like this one.  

I suspect that if I put some effort into it, I could find multiple 100 year precipitation events at various locations in southern Utah this summer (and probably northern Utah too).  Another way to think about that, and this is a bit of an oversimplification (but so is recurrence interval), is that about 1 in 100th of southern Utah will see a 100 year storm in any given summer.  The Moab event was rare for Moab, but it may not be rare for southern Utah in the monsoon.  

I often like to say that we are not prepared for the climate of the 20th century, let alone the climate of the 21st century.  The frequency or recurrence intervals of extreme events in our part of the world my contain estimate uncertainties simply because they are based on a limited time period at a limited number of sites.  This is especially true for precipitation accumulations in short time intervals like an hour or 15 minutes.  Additionally, for precipitation, these are point estimates and what would be really helpful is information on the characteristics of precipitation within individual catchment basins.  Radar can provide a path forward, although there are many areas of Utah that remain undersampled.   Finally, in a warming world, the statistics of the past may not represent the statistics of the future and storm intensity is expected to increase.  It will be essential that we learn from events like this one and build resiliency to future extreme weather and climate events.  

Monday, August 22, 2022

Monsoon Musings

Convection associated with the North American Monsoon had a major impact on southern Utah (and even parts of northern Utah) over the past few days when several notable flash floods occurred.  

One was in Moab where a state of emergency was declared after downtown and environs were flooded severely on Saturday night.  

Radar imagery during the period showed a cluster of thunderstorms moving slowly eastward.  In the image below, an especially strong cell is due east of Moab (southeast of CNY, the 3-letter identifier for Canyonlands airport) over the headwaters of Mill Creek, which became a raging torrent.  

Source: NCAR/RAL

On the previous day, Friday, Aug 19, multiple hikers experienced a flash flood in the Virgin Narrows in Zion National Park, apparently near the Temple of Sinawava near the end of the Zion Canyon Scenic Drive.  One hiker is still missing, and search and rescue operations are ongoing.  

If you are planning outdoor activities in southern Utah, the National Weather Service issues a flash flood potential rating for several national parks and recreation areas at https://www.weather.gov/slc/flashflood.  Consult it as you would an avalanche report before backcountry skiing, adjusting plans accordingly.  In many instances, these flash floods are unsurvivable.  

Finally, I've seen some call the event in Moab a 100-year event.  The one hundred years here represents an average recurrence interval of precipitation in a given period at a point.  It is possible to obtain these at the NOAA Precipitation Frequency Data Server.  

One needs to be very cautious when using and interpreting these recurrence intervals.  First, they are based on prior observations from a relatively limited number of sites, indicated below.  

Source: https://www.weather.gov/media/owp/oh/hdsc/docs/Atlas14_Volume1.pdf

And the period of record varies depending on the station.  Monsoon thunderstorms are very hit-and-miss and extreme events are often undersampled by a limited number of stations with short periods of record.  This results in important uncertainties in the estimates of the return intervals of extreme events.  

Second, these are recurrence intervals at a point.  Monsoon thunderstorms can be very localized.  The probability, for example, of say an inch of rain in an hour at a point is much lower than it happening in any given region. Don't be surprised if you hear of two 100 year events happening in a given region like southern Utah in the same year.  It happens.   

Finally, these return intervals are based on prior observations.  The climate is changing.  Their representativeness is declining as the climate is warming.  

Monday, August 2, 2021

Last Night's Deluge

Thunderstorms with heavy rain, frequent lightning, and nearly continuous thunder move north-northwestward into the Salt Lake Valley from the Wasatch Mountains, resulting in a number of issues related to flash flooding. Portions of the northern Wasatch Front were also affected.  

The system that affected the northeastern Salt Lake Valley, including Mill Creek, Sugarhouse, St. Mary's, the University of Utah, Downtown, and the Avenues began to develope over the Wasatch Mountains just before 0000 UTC (6 PM) yesterday evening.  At 2352 UTC (5:52 PM MDT), the first strong cell appeared over Big Cottonwood Canyon.


This cell exploded in intensity and coverage over the next 20 minutes.  Anyone recreating in Big Cottonwood or Mill Creek Canyon would have been quickly overwhelmed by heavy rainfall, and possibly small hail.  A second cell began to develop at this time on the Alpine Ridge south of Little Cottonwood. 


At this point, all hell began to break loose as more thunderstorms developed along the northern Wasatch Mountains as far north as Francis Peak.  


These heavy storms persisted over the Wasatch for some time as the National Weather Service began to issue severe thunderstorm and flood advisories.  By 0107 UTC (0707 PM MDT), heavy rainfall, lightning and thunder, and probably a few areas of small ail extended from Lone Peak nearly to Francis Peak. 


At 7:14 PM, I took the photo below looking southeastward toward the central Wasatch.  It shows heavy precipitation over Olympic Cove and Mill Creek Canyon.  


After this time, the system began to move and build westward, and by 0152 UTC (0752 MDT), heavy rainfall with pockets of small hail covered much of the Salt Lake Valley east of I-15, with the heaviest precipitation north of I-80.


Radar estimated precipitation for the 3-hour period ending at 0307 UTC (0907 PM MDT) shows the heaviest precipitation int two regions.  The first is in the high terrain between Big Cottonwood and Mill Creek Canyons where radar-estimates reach above 3".  The second is in the mountains east of the University of Utah northeastward into the Session Mountains east of Bountiful. 


Pacificorp has a weather station at 6600 ft along the Big Cottonwood Canyon highway, very close to the radar-estimated precipitation maximum.  As illustrated in the graphic below, it observed over 3" of rain in less than 2 hours and a peak 10-min accumulation of more than 0.7".  


At the University of Utah, almost 1.5" fell, but precipitation rates around 0800 PM MDT were really intense with 1.4 inches falling in less than an hour.  


For the area around Big Cottonwood Canyon, 3" in 2 hours has an average recurrence interval of more than 200 years.  For the University of Utah, 1.4"/hr has an average recurrence interval of 50 years.  There are a number of issues at play with the interpretation of these recurrence intervals, so we should be cautious making statements like this was a one-in-50 year storm.  In particular, such intervals are for specific points, not areas, and the local nature of convective storms means that the average recurrence interval for a storm of such magnitude somewhere in the Salt Lake Valley or somewhere in the Wasatch Mountains is shorter (for some discussion of this and other issues interpreting recurrence intervals, see our previous post Misconceptions of a 200 Year Recurrence Interval).  Nevertheless, this was a pretty good downpour.  

This morning, it's raining again.  I rode my bike into the office this morning like I used to in Seattle in full rain gear.  I found about a foot of standing water on 11th Avenue, which was closed and I was trying to sneak through on my bike.  Now we need it to stop. 

Wednesday, May 13, 2020

Flash Flood Forecasts

Flash flooding in Little Wildhorse Canyon sadly took the lives of two young girls on Monday.  The situation was one that is common on the Colorado Plateau with precipitation from an afternoon thunderstorm funneled into a narrow slot canyon.  The tweet thread below from University of Utah graduate student Tom Gowan, who was in the area, describe the situation.


Routine weather forecasts produced by the National Weather Service provide general guidance about precipitation, but focused solely on precipitation, not the potential for flash flooding in slot canyons.  For example, below is the zone forecast for the San Rafael Swell region issued Monday morning for Monday calling for a 20% chance of showers and thunderstorms, the latter possibly producing strong gusty winds.

Source: NWS
However, the National Weather Service also produces a southern Utah flash flood potential rating, which is available at https://www.weather.gov/slc/FlashFlood.  This product is provided to help assess the potential for storm-produced flooding in slot canyons, washes, and other low areas.  The product is based on the flash flood potential rating definitions below, which include Not Expected, Possible, Probable, and Expected.

Source: https://www.weather.gov/slc/FlashFlood
I wasn't sure how to access an archive of these ratings, but @erincoxnews at Fox13 posted the one below that was issued for Monday showing a rating of possible for the San Rafael Swell, meaning that some slot canyons, dry washes, and small streams may experience flash flooding. 

Source: https://twitter.com/erincoxnews/status/1260341967231127553
These flash flood potential ratings are available online at the link above and are also commonly posted at National Parks and other recreation visitors centers.  Get an update if you can before heading out to recreate.

Tuesday, May 12, 2020

Hazardous Convective Storms

Yesterday, hazardous convective storms affected locations in Utah, resulting in at least one fatality.

Northern Utah

In northern Utah, convective storms produced strong microburst winds in several areas, resulting in a few downed tree branches and a lot of blowing dust and pollen.  The tweet below includes a video showing dust and probably pollen kicked up by microburst winds moving through downtown Salt Lake City.

There were some downed tree branches reported near Liberty Park according to NWS reports.

Microbursts are produced by strong downdrafts that fan out when they contact the ground, as depicted below.
Source: Fujita (1981)
Yesterday's was a traveling microburst similar to the schematic above, initiated by virga (precipitation aloft) falling from shallow mid-level clouds near the Oquirrh Mountains.  The afternoon sounding from the Salt Lake City airport, collected around the time of the microburst, shows a remarkably dry lower atmosphere with what is known as an "inverted-V" sounding.  Clouds are based just below 500 mb (probably about 8500 feet above ground level) and below the cloud the sounding is remarkably dry, with a 58˚F dewpoint depression at the surface (equating to a relative humidity of only 12%).

Source: SPC
Thus, precipitation from aloft falling into this dry airmass let to dramatic cooling and the formation of a downdraft and microburst winds.

Microburst winds can be very dangerous for aviation and can produce damaging straight-line winds.  In the future, they will be a serious concern for drones, which are being used increasingly for deliveries of all sorts of products.  For example, yesterday's winds would have been above the recommended operating threshold of some (maybe all) drones that are currently being developed for for commercial deliveries of packages of 5 pounds or less.

Southern Utah

At least one person is dead due to flash flooding produced by a thunderstorm near Goblin Valley in the San Rafael Swell south of I-70 and north of Hanksville.  Below is a radar image showing what I believe is the storm at upper right, just northwest of HVE, the abbreviated identifier for Hanksville.

Source: NCAR/RAL
Radar imagery shows storm initiation over the 11,000 foot high Thousand Lake Mountain Plateau north of Torrey and then proceeding to the Goblin Valley area.  Apologies for the crappy video below (source: NCAR/RAL), but I'm working on borrowed time right now. 


There are several popular slot canyons in that area, including Little Wildhorse.  The video below was shot by Atmospheric Sciences graduate student Tom Gowan who was in the area.

Media reports suggest that in addition to one confirmed fatality, some vehicles remained at the trailhead overnight.  Hoping for the best as search-and-rescue operations resume this morning.

Wednesday, June 12, 2019

The Inn River at the Brim

Over the past couple of weeks, the combination of snowmelt and frequent rainfall, including recent thunderstorms, has transformed the Inn River from a beautiful river with a tint of green into a muddy torrent.

The  photos below were taken from the Inn Bridge near old town a few months ago and today, illustrating how the Inn River is filled nearly to the top of its human-made banks.

Photo: Andrea Steenburgh


Another perspective is provided by the photo below, taken from my building at the University of Innsbruck and looking down on the University Bridge.


This morning, I noticed workers installing a temporary fence along the base of the building, presumably for protection.  On that lowest level is a library.  Gulp!


The hydrogram below covers the past few days and shows a rise of about 2 meters in th epast two days, putting it above a "one in 30 year level."  A better way to think about it is that the odds of such a river level are a bit longer than 30 to 1 in any given year, based on statistical analysis of historical river levels.

Source: Tirol Hydro Online
If my interpretation and translation are correct, the chart below shows the minimum, median, and maximum mean daily river flow of the Inn River at Innsbruck.  The lower cool season flows and greater warm season flows, especially from May to August, are apparent.  Currently we're well above the highest maximum during May and June and behind only a couple of events in July and August.

Source: Tirol Hydro Online
The August peaks are likely from late 2005 when there was severe flooding in parts of Bavaria, Switzerland, and Austria (see Heumader 2006).  The photo below was taken during that event and shows flooding along a tributary of the Inn River in the Paznaun Valley.


In Innsbruck a major concern in the August event was the collection of debris upstream of bridges and concern a bridge failure could result in damage of bridges downstream.  


The situation here is currently not that dire, although there is enough water in the Inn to push it unusually high and force the closure of some lower bridges. 


Hopefully we are at the high water mark.