Sunday, August 30, 2015

Bavarian Climate Change and "Research"

Apologies for light blogging during this stretch as I'm in Innsbruck this coming week for the International Conference on Alpine Meteorology, which meets every other year to discuss the latest and greatest research pertaining to mountain meteorology.  Thanks to substantially lower hotel costs and conference fees, I can go to this meeting for only $200 less than the latest meeting I attended that was hosted in the U.S. by the American Meteorological Society (including airfare).  Clearly my professional society has something to learn from our European friends.

Prior to the meeting, we spent a day in Garmisch-Partenkirchen, host of the 1936 Winter Olympics and the capital of winter sports and mountaineering in Germany.  Towering 2200 m above G-P is the Zugspitze, the highest peak in Germany.


Like many resort areas of the Alps, a remarkable infrastructure of rail, cog railways, and aerial trams services the high mountain areas.  Below is the end of the cog railway at the Zugspitzeplatt at 2588 m.  About 4.5 km and 1000 vertical meters of the ascent are within the mountain.  It's unbelievable the effort that was undertaken to build a train to this location.


At the Zugspittzeplatt you can access Germany's longest ski season, but things are closed down this time of year.  What you see before you is the remnants of a dying glacier.  The photo below shows the scene in 1890.  These lower altitude glaciers will be gone soon.


Although I didn't bother to visit it, the Schneefernerhaus, a center for environmental research exists just below the summit of the Zugspitze and is accessed from the Zugspitzeplatt.  Looks like my kind of place.  More info here.  You realize that the U of U had a research station at Alta back in the 60s but they sold it.  It wasn't as spectacular as the Schneefernerhaus, but it would have done just fine!


From the Zugspitzeplatt you can take a short tram to the summit of the Zugspitze.  There, you'll find two faster ways to the summit.  One is the Eibsee cable car, which rises about 2000 vertical meters, the last 2/3 or so in a continuous span at a ridiculous pitch. 


To find the other, you have to walk along the summit platforms and pass into Austria.


There you'll find the  Tiroler Zugspitzbahn cable car.  There was a time when there was a border check on the summit, but thanks to the European Union, passage is seamless today.


Despite the haze (and probably some smog), the views from the summit are pretty good.  Below is G-P.


It's very hot right now by European standards, so after our alpine adventures, we hiked up the Partnatchklamm, a wet, cool Alpine slot canyon.


Time to nap.  I have a talk to give tomorrow.

Wednesday, August 26, 2015

Short-Term Variability and Long Term Trends: Market and Meteorological

What would the media do without short-term market and meteorological variability?  On slow news days they could attempt to cover substantive issues in depth, but that would require investigation and analysis.  Ignore the media hype and separate the short-term variability from the long-term signal and life will be better.

From a meteorological perspective, both the short-term variability and long-term signal are looking pretty good right now.  Yesterday's high was 98ºF, but today will be much cooler.  A potent monsoon surge has pushed into northern Utah.  Check out the rise in precipitable water from ~1.5 cm yesterday morning to over 3 cm this morning.  Looks like they need to reset the scale on the plot below!

Source: ESRL
It's cool and comfortable out there this morning and today's high will probably be only in the high 70s, not much warmer than it is right now.  Showers and thunderstorms will abound.  Enjoy.  This short-term variability is just what the doctor ordered.
As is the long-term trend.  Signs of fall are beginning to appear.  Check out the yellow tint in the trees and the down leaves along the roadside in City Creek Canyon yesterday.  


I don't know what the next few months will be bringing investors, but for us, the long-term trend is a good one.  Fall and winter will be here soon.  

Monday, August 24, 2015

More Good Reasons to Kill Your Parking Pass

Today is the first day of classes at the U.  Insanity will prevail.  Mother Nature is already stirring the pot.  She produced a stray shower on campus just before 8 am that produced a direct hit on the new northwest parking garage.  You could barely see it on radar as it was only a few pixels wide and it was over as fast as it started.


Yup, Mother Nature is not too happy about these new parking garages.  There are two more opening up this semester, the central parking garage in the business loop and the aforementioned northwest parking garage next to my building (INSCC).  The latter, which is still under construction (although it appears they are allowing some people to park in it), is pictured below.


I have great disdain for these parking garages for a variety of reasons.  They are expensive.  They encourage driving to campus.  They block the sun, the sky, and the views of the mountains.  Did I say they are expensive?

In terms of annual parking fees, the central parking garage is a relative steal.  You can get a central A pass to park in it or A lots on campus for $552 or a central U pass also valid in U lots for $498.

However, for northwest campus commuters, commuter services has a special treat for you.  You need a T permit to park in the northwest parking garage, which costs $942, or an even pricier R permit (see http://commuterservices.utah.edu/).  Yikes.  @theU claims this morning that faculty and staff can park in the northwest parking garage today with any permit, but if you are driving in this morning, you will be greeted by a sign saying differently.  I guess "this morning" means before 8 am.


Moving to alternative commuting options isn't possible for everyone, but perhaps it is for you.  In April, I told commuter services to stick it.  I canceled my parking pass and since then I've driven to campus once and paid a few bucks to park in a visitor slot.  There are also options for paying for a day pass to park in an A or U lot, although it's a damn shame that those options aren't easier to access to encourage more mixed mode commuting (see my earlier post How I Told Commuter Services to Stick It).

U student Annie Putman has produced a great video discussing the many campus computing options, including some that I was not aware of, like Zimride for finding others to carpool with.


Perhaps this is the year for you to tell Commuter Services to stick it, at least with regards to your parking pass.  

Saturday, August 22, 2015

Temporary Reprieve

I woke up this morning, looked out the window and lo and behold there were the mountains.  It wasn't clear, but it was less hazy than I've seen it in the morning in a few days.

I decided to get out for a quick hike while the getting was good.  I opted to hike up Hidden Peak to take advantage of the tram on the descent as my knees have been feeling tender of late.  Up high it was actually fairly nice.  Smoky, but not terribly so.  If you look carefully at the photo below, you can see considerable layering of the flow with a nice clear layer near crest level.


Things are, however, deteriorating again, at least in the valley.  The trace below shows the PM2.5 concentrations at the University of Utah over the past five days.  There was a brief drop to just below 10 ug/m3 at about noon yesterday, followed by another bing increase, and then the drop overnight to the lowest values we've seen since the 18th.  Unfortunately, PM2.5 concentrations have jumped back up to 20, although at least for now, they are lower than they have generally been the past few days.


Amongst the many fundamental differences between this pollution event and our winter inversion events is that most of the PM2.5 is being transported in rather than being produced from local emissions. As a result, changes in flow direction can cause some large variations in PM2.5.  I guess for now the best approach if you want to get outside is to take advantage of the less hazy periods when you can.

Friday, August 21, 2015

CPC Gives Northern Utah Skiers No Love

The NOAA/NWS Climate Prediction Center (CPC) issued their latest three-month outlooks yesterday and they give northern Utah skiers no love.

For December through February, they give northern Utah slightly elevated chances of above average temperature and slightly elevated chances of below average precipitation.

Source: CPC
Source: CPC
Does this mean we're in for another warm winter with bad snow?  No.  In the images above, equal chance (EC) areas in white are not projected to have an average winter.  Instead, EC means that the likelihood of below average, average, or above average temperature or precipitation does not differ from their climatological odds of 33.3% each.  In other words, the tools available for seasonal forecasting do not allow us to anticipate a strong loading of the seasonal climate dice one way or the other.  Areas in red (temperature) or brown (precipitation) are areas where the likelihood of above average temperature or below average precipitation, respectively, are higher than climatology.  So, for northern Utah, they are giving us just slightly higher than climatological odds of above average temperature and below average precipitation since the odds are between 33% and 40%.  In other words, the seasonal climate dice are loaded just slightly on the side of above average temperature and below average precipitation.

These outlooks are based on a variety of tools including seasonal climate forecasts, composites (averages) of past years stratified by El Nino, La Nina, and neutral conditions (this year they are banking on El Nino), and a few other statistical tools relating past weather to various factors.  El Nino composites typically feature a precipitation dipole with below average precipitation over the interior northwest and above average precipitation over the southwest, roughly consistent with the outlook above.  Below is the average precipitation anomalies from three ensemble suites produced by the NCEP Climate Forecast System (CFS) for December to February.  I've drawn a black line at the approximate position of the central Wasatch.  Each of these ensemble means has a dry northwest and a wet southwest relative to climatology, with the central Wasatch in the transition zone.

Source NCEP
Keep in mind that the composites generated by CPC use very coarse precipitation data that does not specifically look at the central Wasatch, while the CFS does not resolve the Wasatch in any way, shape, or form.  Thus, one needs to be cautious in interpreting these outlooks and projections.  We can, however, use past data from Alta Guard to stratify central Wasatch snowfall by El Nino, La Nina, and Neutral and even strong El Nino and La Nina events, as we have done several times in the past (e.g., El Nino Likely for the 2015-16 Winter).  You probably know the story here.  Not much signal in the noise.  We've boldly put a linear trend line on the data, which does show a very small trend to lower values as one transitions to strong El Nino, but the scatter is so large that I think that's neither physically or statistically significant (we haven't bothered looking at the latter).  Note that this is for various 3-month periods during the cool season, not specifically December to February as in the plots above.  This scatter exists because: (1) Utah sits in the transition zone between the El Nino/La Nina precipitation dipoles, (2) other factors affect the seasonal climate besides El Nino, and (3) there is always some randomness in the weather that occurs during any given season.  

So, we may be looking at a Godzilla El Nino, but for the central Wasatch, that means nothing.  Don't fall for the hype.  For the central Wasatch, we really have no idea what kind of winter we are going to have.  It could be big, it could be bad, or it could be average.  Further, the amount of snow we get isn't always as important as when it comes and how it comes and those details are even more uncertain.  

Thursday, August 20, 2015

Earth's Fever Reaches Record Levels

No surprises here.  The National Centers for Environmental Information issued their monthly summary for July and the globally averaged temperature was the highest for any month since the start of records in 1880.  Their full report is available here.

Meteorologists typically present temperature trends in terms of anomalies (i.e., a departure from some long-term average).  For July, the globally averaged temperature anomaly was 0.81ºC (1.46ºF), the highest on record.  In 2nd place is 1998, also a strong El Nino year.

Source: NCEI
Since July is also the warmest month of the year globally (this reflects the greater fraction of land in the Northern Hemisphere), this July was also the warmest in the entire 1627 month record going back to 1880.  Yup, Earth has a fever and the only prescription is more cowbell.


Or, more accurately, the only prescription is less carbon. It is the combination of long-term global warming with the strong El Nino that is leading to these unprecedented numbers.  

Like politics, all weather is local and the good news for Utah is despite remarkable high globally average temperatures, Mother Nature was good to us and we actually came out below the 20th century average and enjoyed the coolest July since 1997.

Source: NCEI
Our good fortune is clearly evident in the analysis below which shows departures from average temperature for the month.  We're in the blue, indicating below average, but red, indicating above average predominates.  Note that these anomalies are with respect to 1981–2010.  Comparison with the 20th century average would produce a plot shifted even more into the red since the 20th century average temperatures are lower than those of the last 30 years.  
Source: NCEI 
The likelihood that 2015 will be the hottest year on record continues to increase.  

Wednesday, August 19, 2015

There's No Escape from the Worsening Pollution

Smoky sunrise over the Salt Lake Valley this morning.  Note the faint outline of the Wasatch Mountains on the left side.
Over the past three days, air quality over the Salt Lake Valley has deteriorated as smoke from fires to our west and northwest is transported into the area.

This morning, hourly averaged PM2.5 concentrations sit at 32 ug/m3 and are approaching the transition from moderate to unhealthy for sensitive groups.  
Source: DAQ
There was a spike to even higher values the day before yesterday, but I'm not sure if I believe it.  We didn't see it in our data from the University of Utah, which shows we're currently sitting at the highest PM2.5 concentrations of the entire event.  

Source: MesoWest
Making the situation even more miserable is the ozone.  Ozone is photochemically produced (i.e., produced by sunlight) and thus tends to reach a peak in the afternoon.  We've been topping out each afternoon at about 70 parts per billion, which is also in the moderate category.

So basically, we have a noxious mix of both PM2.5 and ozone in the afternoon and evening and I suspect we'll see the highest levels of the former this afternoon.  I may elect to skip my bike ride later today.  

Unlike wintertime inversion events, you can't climb above this stuff.  Mixing in the summer extends through a deeper layer.  The photo below was taken yesterday by the KSL Helicopter and you can see the top of the gunk sitting above the crest of the Wasatch.  


This summer, a major field program is taking place to examine the aerial extent and underlying processes of high surface ozone concentrations in the Great Salt Lake Basin called the Great Salt Lake Summer 2015 Ozone Study.  It involves collaborations between the University of Utah, Utah State University, Weber State University, and the Utah Division of Air Quality (more info here).

As part of the project KSL has graciously allowed sensors to be placed on their news chopper and the data is extremely illuminating.  The data below was collected yesterday.  The blue line is the chopper altitude (above mean sea level) and the green line is the ozone concentration.  Ozone concentrations were between 60 and 65 ppb when the chopper was below about 3000 m, but as the chopper ascended above 3000 m, they climbed to nearly 70 ppb right at the top of the gunk layer (about 17:05 local time).  Then, the chopper briefly penetrated into cleaner air aloft and the concentrations dropped to less than 50 ppb.  The chopper then descended back into the gunk layer, finding the 60 ppb air once again below about 3000 m.

So, you have no hope of climbing above this in Utah unless you have a plane or helicopter.  Further, and this has been found in other areas, ozone concentrations may actually be somewhat higher at higher elevations near the top of the gunk layer.  We're stuck in it and there's no escape.  Our best hope is a shift in the flow direction.  Next week looks cleaner with southwesterly or southerly flow, but it's hard to say if the weak systems coming through later this week and this weekend will crack the smoke or just give us temporary or partial relief.  

Tuesday, August 18, 2015

Smoky Views and Fire Numbers

Generally clear skies over the northwest U.S. enabled an excellent perspective on the smoke from the MODIS sensor on NASA's Aqua satellite.  It seems pretty smoky here, but it barely shows up in this image.  Conditions are far worse to our west and northwest.

Source: NASA
Some of the fires have devastated communities.  Here are a couple of photos of damage near Lake Chelan, WA from KING TV.  The bottom one is from Lake Chelan State Park.

Source: KING-TV
Source: KING-TV
The National Interagency Fire Center currently rates the national firefighting preparedness level at a V, the highest possible, which indicates that major incidents have the potential to exhaust all agency resources.  Yesterday the center called in 200 active military troops to help with wildfire fighting efforts across the west.  This is the first time they have done so since 2006, although 200 seems like a small number and I wonder if more will be called soon.

Here are some remarkable numbers for active incident firefighting efforts in the various geographic areas.  Resources are heavily concentrated in the northwest (NWCC) and northern California (ONCC).  
Source: NIFC
And some numbers for the year to date on the number of fires and acres burned, which have now eclipsed 40,000 and 7 million acres, respectively.  5 million of these acres are in Alaska.  

Source: NIFC
Utah has avoided major problems so far.  Let's hope it stays that way and that things improve elsewhere. 

Sunday, August 16, 2015

Exploring Mary Ellen Gulch

Given all the smoke that was around today, my son and I decided to explore some of the mining history in upper American Fork Canyon's Mary Ellen Gulch.  AF Canyon is a beautiful place and a huge canyon.  It's also hard to access via car unless you have an ORV, high-clearance vehicle, or huge heart–lung capacity.  I have none of these, so we elected to access it via the Snowbird tram.  It's remarkable how few people do this and we had all of upper Mary Ellen Gulch to ourselves and saw only a couple of ORV groups down near the mines.

The route is pretty easy to follow.  From the Snowbird Tram you just head out the Bookends Traverse until you hit Sunday Saddle, the pass to Mary Ellen Gulch.  Follow the various roads down wherever your whims take you.


Here's the view into Mary Ellen at the end of the Bookends Traverse.  Our objective was an area marked as "Globe Mines" on the USGS topo.  You can just make out a cabin in that area (just to the left of the word "Globe."


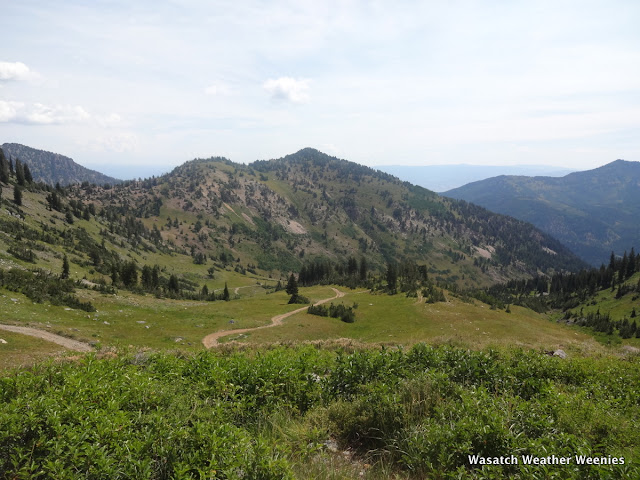
Mary Ellen Gulch is fairly nice, but the hiking is all on nasty ORV roads.


Looking down the gulch toward Miller Hill.


One of the mines.  The efforts people went through to mine in the Wasatch is really remarkable.  Some discussion of the various activities is available at the USFS web site.


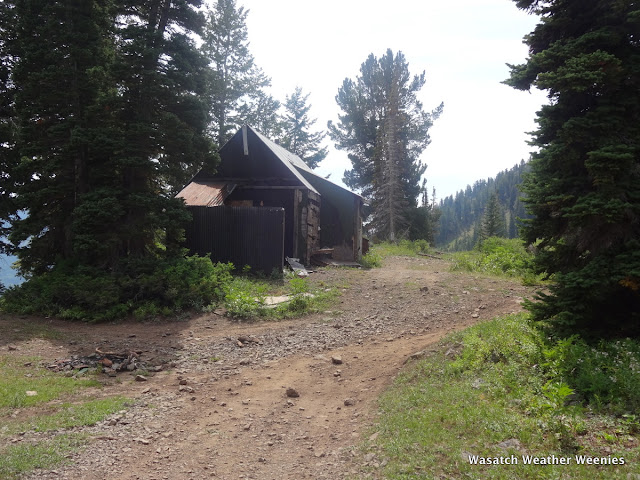
This miners cabin is not very old compared to most, but has clearly been abandoned.  I wondered when it was last refurbished and used.  


One of the scarier outhouses I've seen.  Fortunately, it wasn't needed.


Dinner awaited us inside the cabin.


As well as 5-star lodging.


We did some exploring along an old Miner's trail.  


The view from the end of our explorations looking back through Sinner's Pass at Devil's Castle.  We weren't far from the south ridge from the AF Twin and I briefly entertained thoughts of bagging the summit, but my back had different ideas and we wisely turned around.  


Beware if you are thinking of doing this that Snowbird is charging $5/day for parking during Octoberfest via Entry #1, #2, and #4.  They didn't seem to be charging for parking further up the bypass road.  

Smoke from Distant Fires?

For a time yesterday I could smell smoke in the Salt Lake Valley and its certainly smoky this morning.


Where is the smoke coming from?  A possible local source is the Berry fire, which has burned 175 acres in Tooele County (fire 78 in the map below).  There was also a small fire in Parley's yesterday, but I doubt that's a contributor.  More remotely, there are a number of large incidents in northern California and the Pacific Northwest. 

Source: NIFC
This morning's sounding provides some hints at the smoke source, but not unambiguously.  We've had a weak trough passage that's resulted in a shallow layer of northwesterly flow at low levels.  Above this layer, however, the flow is southwesterly.  Thus, I'm inclined to go with the view that the trough passage has ushered in smoky air from either northern California or the Pac NW, but there is a possibility that smoke from the Berry fire is being carried into our area by the SW flow aloft.  

Source: SPC
I lack the time this morning to dig into this further, so I leave it to other meteorological sleuths to investigate and comment. 

Friday, August 14, 2015

Wasatch Weather Weenies Survival Guide for El Nino

It is nearly a virtual lock that this coming winter will be an El Nino winter and most indicators are suggesting it will be a strong event (see the El Nino advisory issued by the Climate Prediction Center yesterday).  Given that we've been talking about this event for several months, this will either be the most anticipated event of all time or a colossal forecast bust.  Apparently one NASA scientist called the event a Godzilla El Nino, with the phrase going viral now in the media.  You'll see all sorts of hype and hyperbole in the coming weeks with regards to what kind of ski season to expect.  Here's a survival guide for Wasatch Weather Weenies.

1. Don't worry, be happy.  The correlation of Wasatch snowfall with El Nino and La Nina is so low that there's no point worrying about it.  The graph below shows the Alta Guard snowfall vs. the El Nino phase, as we've discussed in previous posts (e.g., El Nino Likely for the 2015–16 winter, 12 June 2015).  Nobody can reliably predict what is going to happen in the Wasatch this winter, so don't listen to people who claim they can.


2. Beware of small sample sizes.  Every El Nino period has somewhat different characteristics and weather.  El Nino is an important player in climate variability, but it isn't the only game in town. Because of the strength of this El Nino, you'll see all sorts of predictions for the coming winter based on a small number of events.  In some instances, a small sample can be dominated by a signal, but in others, you're just seeing noise.  Buyer beware.

3. Play the odds.  Based on existing understanding and a wide range of predictive tools, the most likely areas for above average snowfall and snowpack during the coming winter is in the upper elevations of southern California,  Arizona, and New Mexico.  The dice are somewhat loaded, but not as strongly, as one moves northward into the upper elevations of central California, southern Utah, and southern Colorado.  Whether or not these areas get off to a fast start to the ski season in November and early December or get hammered on your vacation is completely at the whims of the weather gods.  However, these are the areas that have the greatest likelihood of above average snowfall by the end of winter.  

4. Remember that the friendly confines of the central Wasatch really are friendly. It snows a lot here.  Yeah, last year sucked, but most bad years in the central Wasatch are still better than a good year elsewhere.  Are you really going to leave the central Wasatch to ski the Arizona Snowbowl because they are likely to have an above average snow year?  Everything is relative.

Thursday, August 13, 2015

Is the Great Salt Lake Approaching a Record Low Stand?

Modis Image of the Great Salt Lake taken 9 August 2015.
Based on historical levels, the Great Salt Lake is going through an especially low period.  Is it, however, a record?  It turns out this is a surprisingly difficult question to answer.  What could be so hard about measuring the elevation of a lake?  

The Great Salt Lake is a terminal lake (i.e., it has no outlet) and thus the surface elevation and area of the lake fluctuate with variations in inflow and evaporation.  The former plays a primary role with long-term wet periods leading to high stands and long-term dry periods leading to low stands.  High stands occurred in the 1870s and 1980s, with a record minimum of 4,191.3 feet in 1963.
Source: USGS
We are currently in a long-term dry period and the Great Salt Lake levels are relatively low (note that the graph above ends in 2006, so don't use it for the recent past).  As shown below, the USGS guage at Saline is presently sitting at only 4191.4 feet, just a shade above the record low.  Thus, a record should be imminent right?  
Source: USGS
Not so fast.  If we examine the gauge at Saltair, we find that the lake level is sitting at about 4193.3 feet, nearly 2 feet higher than the record low from 1963 (note the shift in range of the y-axis compared to the plot above).  

How can the lake level vary by almost 2 feet between these two gauges?  In 1956 the Southern Pacific railroad began construction of a rock-fill causeway across the center of the Great Salt Lake, which was completed in 1959.  You can see the location of the causeway in the MODIS image at the top of this post as there is a clear contrast in the color of the two halves of the lake that it separates.  Breaches have subsequently been added to the causeway to allow some flow between the two halves, but ultimately the Great Salt Lake remains a lake divided.  Much of the freshwater inflow enters the southern half of the Great Salt Lake.  As a result, the southern half of the lake is usually higher than the northern half, as is the case at present, leading to a higher reading at Saltair (southern half) compared to Saline (northern half).  

Now let's talk about the record.  It is fairly clear that the historical low stand of the Great Salt Lake occurred in 1963.  That was shortly after the completion of the causeway.  At that time, measurements were only collected at Saltair in the southern half.  Saline wasn't added until 1966.  The record of 4191.3 feet was based on a measurement at Saltair.

Thus, it appears that water levels in the northern half of the Great Salt Lake may be nearing an all-time low, although we don't have measurements from Saline in 1963 to confirm this.  It is possible, given the existence of the causeway that water levels in the north half in 1963 were even lower than they were in the south half.  Water levels at Saltair are presently above those measured in 1963, although the current low stand probably qualifies for the 2nd lowest in the historical record.  

It is possible that there are some manual observations of water levels or photographs that might shed a bit more light on this issue.  It would be an interesting project to explore.  Too bad we didn't have high-resolution satellite images in 1963!