Showing posts with label Societal Impacts. Show all posts

Sunday, November 17, 2024

How to Break the Jet Stream

A major transition in the structure of the jet stream will occur over the next few days, resulting in the development of an omega block over the Norh Pacific Basin and high-impact weather for northern California and the Northwest United States.

The plot below is a combined sea level pressure (black contours) and dynamic tropopause (jet-stream level) forecast for 0000 UTC 18 November (5 PM MST Sunday). I have identified the jet stream over the North Pacific Basin and North America with a black line.  The forecast shows a deep low pressure system over the Sea of Okhutsk (at the tip of the L1 arrow).  Downstream of it, there is strong southerly flow at the surface.  L1 and the strong southerly flow ahead of it don't look at that disruptive, but combined with warming due to condensation in the precipitation system accompanying them (not shown), they serve as the proverbial straw that break's the camel's back. 

By 0900 UTC 19 November (2 AM MST Tuesday), L1 has weakened, but the ridge downstream of it has amplified substantially.  Concurrently, the surface high pressure system, H1, has also amplified.  This is an example of the mutual amplification of an upper-level ridge and surface high pressure system.  However, that's not all that is going on.  The trough downstream of that ridge is also amplifying, and another low pressure system, L2, is starting to develop over the eastern Pacific.  

By 0000 UTC 20 November (5 PM MST Tuesday), the jet stream pattern over the Pacific Basin is highly amplified (call it wavy if you want) and L2 has turned into a monster as it and its accompanying upper-level trough mutually amplify.  L2 is what we call an explosively deepening cyclone, or bomb because its sea level pressure drops so fast.  Before numerical weather prediction and our ability to anticipate explosively deepening cyclones, such a storm would have been a shipwrecker, coming out of nowhere to  produce dangerous winds and seas that are a marine nightmare.  Today, we know it is coming, but it will still be a beast. 


Finally, by 1800 UTC 20 November (11 AM MST Wednesday), the omega pattern is fully developed with the high-latitude ridge and mid-latitude troughs forming a clear "omega" pattern covering the North Pacific Basin. 

This "breaking" of the jet stream results from the progressive amplification of a series of upper-level ridges and troughs (and accompanying surface high and low pressure systems) through a process called downstream development.  The end result is a high-amplitude flow pattern and in many cases high-impact weather.  

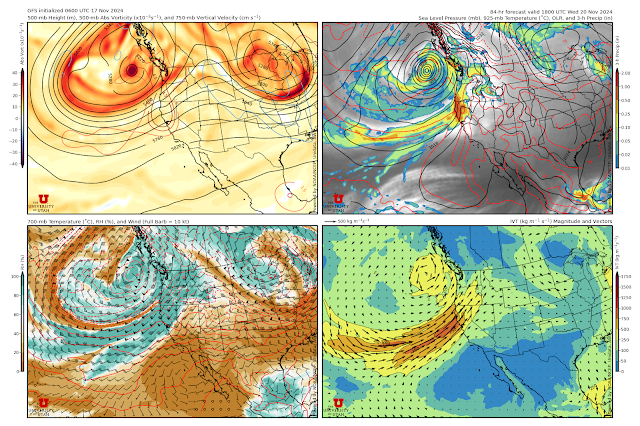
In this case, the high impact weather is in the form of L2, an explosively deepening cyclone, and it's accompanying atmospheric river, which looks to bring heavy rainfall to portions of northern California and the Pacific Northwest. Looking at the GFS forecast for 1800 UTC 20 November (11 AM MST Wednesday) shows L1 off the coast of Washington and British Columbia (upper right panel in the figure below), but the accompanying atmospheric river, identified by the high integrated vapor transport (IVT) values in the lower right plot below, is aimed straight at northern California.  This is a flow configuration that can produce heavy rainfall in the coastal mountains and southern Cascades.

The IVT associated with this system is high, but not exceptionally strong.  In the forecast above it tops out between 750 and 1000 kg/m/s, whereas extreme values can reach over 1500 kg/m/s.  However, due to the high-amplitude nature of the flow, this is a slow moving system, so the AR will be pointed at that area for a long time.  The Center for Western Weather and Water Extremes (C3WE) has created an AR scale to rate the intensity of atmospheric rivers and their impacts that considers both the strength and persistence of high IVT.  On a scale of 1-5, this one rates a 4 on the coast of northern California based on the control run of the Global Ensemble Forecast System (GEFS), another model used for weather prediction.

By now you are probably wondering what all this means for Utah.  It probably means a bit of a break after the weak system that moves through on Monday.  After that system, we look to be to the south of the AR, in an area that is relatively dry.  As a result, the Utah Snow Ensemble plume for Alta-Collins shows a bit of snow around 0000 UTC 19 November (5 PM MST Monday), and then 3 days of what looks to be dry weather.  After that, there is a wide range of possibilities.  

To summarize, the next few days will provide an example of how Mother Nature can break the jet stream and produce a high-amplitude flow pattern, explosive cyclogenesis, and high impact weather.  I'd say buckle up, but Utah is not in the crosshairs, at least for the next few days.

Tuesday, May 2, 2023

Gordon Lightfoot (1938–2023)

Gordon Lightfoot died yesterday at the age of 84.  The Canadian singer-songwriter wrote one of the greatest weather related songs of all time, "The Wreck of the Edmund Fitzgerald."

It was, in fact, one of the first two records that I bought as a kid, and the 45 looked exactly like the one below.  The yellow-orange label is seared into my synapses.

What role it played in my eventual career path is unknown, but I loved the song and probably love it even more today.  The lyrics are historical, haunting, poetic, and powerful.

The legend lives on from the Chippewa on down
Of the big lake they called Gitche Gumee
The lake, it is said, never gives up her dead
When the skies of November turn gloomy
With a load of iron ore twenty-six thousand tons more
Than the Edmund Fitzgerald weighed empty
That good ship and true was a bone to be chewed
When the gales of November came early

The ship was the pride of the American side
Coming back from some mill in Wisconsin
As the big freighters go, it was bigger than most
With a crew and good captain well seasoned
Concluding some terms with a couple of steel firms
When they left fully loaded for Cleveland
And later that night when the ship's bell rang
Could it be the north wind they'd been feelin'?

The wind in the wires made a tattle-tale sound
And a wave broke over the railing
And every man knew, as the captain did too
T'was the witch of November come stealin'
The dawn came late and the breakfast had to wait
When the gales of November came slashin'
When afternoon came it was freezin' rain
In the face of a hurricane west wind
When suppertime came, the old cook came on deck sayin'
"Fellas, it's too rough to feed ya"
At seven PM, a main hatchway caved in, he said
"Fellas, it's been good to know ya"
The captain wired in he had water comin' in
And the good ship and crew was in peril
And later that night when his lights went outta sight
Came the wreck of the Edmund Fitzgerald
Does any one know where the love of God goes
When the waves turn the minutes to hours?
The searchers all say they'd have made Whitefish Bay
If they'd put fifteen more miles behind her
They might have split up or they might have capsized
They may have broke deep and took water
And all that remains is the faces and the names
Of the wives and the sons and the daughters
Lake Huron rolls, Superior sings
In the rooms of her ice-water mansion
Old Michigan steams like a young man's dreams
The islands and bays are for sportsmen
And farther below Lake Ontario
Takes in what Lake Erie can send her
And the iron boats go as the mariners all know
With the gales of November remembered
In a musty old hall in Detroit they prayed
In the maritime sailors' cathedral
The church bell chimed 'til it rang twenty-nine times
For each man on the Edmund Fitzgerald
The legend lives on from the Chippewa on down
Of the big lake they called Gitche Gumee
Superior, they said, never gives up her dead
When the gales of November come early

The song was six minutes long, yet you always wanted to know more.  The causes of the shipwreck remain unclear with many hypotheses proposed, although wind and waves were a contributor. Modern analysis and modeling tools have been used to describe the meteorology that led to the tragic loss of life, indicating peak gusts above hurricane force and waves higher than 20 feet (see Hultquist et al. 2006).  Surface analyses of the event show the passage of an intense extratropical cyclone, with Lake Superior in the intense pressure gradient to the southwest of the low at 0000 UTC 11 November (lower right image).  The ship was lost about 15 minutes later.

Source: Hultquist et al. 2006

In many ways, it resembled a powerful oceanic cyclone.  Norwegian meteorologist refer to that region of of a deep cyclone as the poisonous tail of the bent-back occlusion due to the hazards posed for mariners.  It can feature what meteorologists call a sting jet, which wraps around the low center and descends to the surface.  

The song has inspired many meteorologists, if not to enter the field, then to ponder the meteorology of the event.  

Rest in peace Gordon Lightfoot and those who perished in this tragedy.  

Tuesday, January 19, 2021

Yesterday's Snowmaggedon

January has brought a whopping...wait for it...16.5 inches of snow to Alta through January 19.  That's not a lot, but many driving through Little, Big, or Parley's canyon got bit by the red snake anyway.  

Highway impacts from winter storms depend on several factors.  Snowfall amount can matter, but snowfall intensity, pavement temperatures, traffic, timing, and other factors can cause even storms with relatively small totals to cause huge problems.  

Twenty-four hour snowfall total in the central Wasatch through this morning are in the 1-3" range.  However, most of that snow fell in the late afternoon with relatively high intensity, especially west of the crest, strongly affecting road conditions in the canyons.  

Source: NCAR/RAL

The situation at the time was a bit unusual.  Winds at mountaintop level (e.g., on Mt. Baldy and at the top of the Snowbird tram) were weak and northerly as we were beginning the transition to the easterly flow that would develop overnight and produce downslope winds along some areas of the Wasatch Front.  However, upstream, northwesterly flow was impinging on the Wasatch Range over the Salt Lake Valley.  Some light easterlies were observed in the Olympus Cove area, but I suspect this was produced by local outflow from the precipitation area along the west slope of the Wasatch.  


The afternoon sounding was consistent with the surface-based observations with northwesterly flow at low levels and very light flow at crest level (700 mb or 10,000 feet). 


Thus, it appears that shallow, low-level upslope flow led to the frequent initiation of shallow convection over the westernmost portions of the central Wasatch.

Additionally, the layer from about 750 to 600 mb was between -10 and -20˚C, a temperature range known as the dendritic growth zone.  This is a range in which ice crystals, when conditions are right, can grow rapidly.  I was out walking yesterday with a world-famous meteorologist and we both commented about how even the smallest cumulus clouds were producing virga.  

Finally, weak flow at crest level, these crystals had no where to go.  The fell out predominantly at and west of the crest.  

This led to traffic armageddon in all three canyons as down-canyon traffic was picking up at the end of the day.  Below is the UDOT traffic camera at Alta showing the dreaded red snake at...wait for it...6:22 PM.  
Source: UDOT

At that time, it appeared it wasn't even snowing anymore and I was seeing tweets claiming it took 2-2.5 hours to get down the canyon.  All of this, despite the fact that the Snowbird snow cam showed only about 3 inches on the stake.  

Source: Snowbird

And, to add insult to injury in this low-snow year, the strong winds last night have done their damage, transporting and beating up the snow.  


I miss real winter. 

Tuesday, December 15, 2015

Storm Perspectives

It's been quite a while since we had a storm like this, especially on the valleys and benches.  It's great to have winter as it should be.  A few thoughts on the event this morning.

How good were the forecasts?

Snow forecasting in northern Utah is all about synoptic possibilities and mesoscale uncertainties.  The former means that we can often anticipate when the large-scale ingredients for a significant storm are present, but the latter implies that the devil is in the detail and specific forecasts of the timing, intensity, and spatial distribution of the snowfall is exceedingly difficult.

For the present storm, we had strong agreement amongst the models and ensemble modeling systems that a significant storm would hit the state.  The NWS issued watches and warnings in a timely manner with good lead time.  The forecasts did not capture, however, some aspects of the snowfall timing, intensity, and distribution, most notably in some bench areas where the snow came harder and faster yesterday than anticipated, resulting in greater accumulations than forecast.  In addition, their briefing on Sunday afternoon suggested that the Salt Lake Valley may see less of an impact for the Monday morning commute (emphasis on may), although my small sample of Sunday evening news broadcasts didn't seem to give much of a hint of this.


Forecast updates yesterday afternoon for last night also appear to have overdone the overnight accumulations, at least in the Salt Lake Valley.  Nevertheless, given the limitations of the science today, by and large the forecasts were generally good for this event.

Failure to prepare is preparing to fail

Yesterday morning's rush hour was a mess.  The first major storm of the year is always bad, but really this was the first major storm in two years, and it showed.  A few thoughts come to mind.  First, it appears we've forgotten what snow looks like.  Yes, that white stuff on the road really is snow and it does pay to slow down when driving on it.  Second, the bald tires we've been putting off replacing now for two years really don't work in the snow.  Finally, when our tires slip, it can be satisfying to push the accelerator all the way to the floor, but that really doesn't do any good.  Of course, these statements don't apply to any of us as I'm sure all readers of this blog were well prepared :-).

What surprised me most about this event was how unprepared the U and many school districts appeared to be.  Given the forecasts, I didn't expect that.  The contrast in the information feed from yesterday morning to this morning is quite large and suggests that everyone was at best out of practice and at worst simply did not take the forecasts seriously.  Yesterday I received no notices from the U during the morning rush hour and when I finally did get one, it came via a forwarded e-mail from our administrative assistant because the system was apparently overloaded.  Today, I've already received a notice concerning campus status.  Much better.  Ditto for West High where my children attend.  No info until late yesterday morning, but notices are flying in via text and voice mail today.

I do feel for those who have to provide these notices and make closure decisions.  Forecast reliability for these events isn't as high as we would like, and there are a significant number of false alarms for major snow events.  On the other hand, yesterday seemed like a case of being unprepared.  Hopefully we've gotten that out of our systems and we're ready to go for the rest of winter.

Stuff I don't understand

The enhancement of precipitation on the eastern benches of the Skull, Tooele, and Salt Lake Valleys (as well as the Bountiful Bench) was most impressive and produced precipitation rates (snowfall and water equivalent) that were much higher than observed in the higher mountains.  Although I have hypotheses for why this happens, I don't really understand why.  Further confusion is added by the overnight transition to higher precipitation rates at Alta-Collins, which (fortunately) yielded another 14 inches of snow and .45" of water after 6 PM.


We don't understand these variations in orographic enhancement and we certainly can't forecast them.  Some of you people out there who are smarter than me should help us figure this out.

Saturday, November 28, 2015

Sometimes It Doesn't Take Much

There is not always a direct relationship between the amount of new snow and road-weather impacts.  Sometimes a little is enough to create problems.

The snow that fell late last night didn't come fast and furious.  It started at the Salt Lake City airport at around 4:50 AM MST and has added up to a whopping .03" of water equivalent through 8:40 am this morning.  That's probably pretty close to what I got in the Avenues foothills.


However, after the cold weather the past couple of days, the road surfaces are cold and the snow is sticking.  In addition, I suspect the road crews were caught off guard and nothing was plowed when I woke up this morning in my neighborhood.  Further, Commuterlink at 8:48 AM MST showed fairly slow going for a Saturday along much of I-15 and I-215 through the Salt Lake Valley.

Source: UDOT
Traffic cameras showed the light snow covering all but the busier lanes.

Source: UDOT
An inch at Alta so far.  It's not much, but I'm starting to learn to appreciate anything we get.

Friday, January 31, 2014

How Tough Is Your School?

Through a number of channels, including this one at The Blaze, you can access the map below by Redditor atrubetskoy approximating how much snow is needed to cancel school.


A map like this can be the source of pride (congrats northern New Englanders) or shame (bury your heads southerners).  Of course, like all estimates, this one has its shortcomings.  For example, having grown up in upstate NY in that area of dark blue where 24+ inches is allegedly needed to close school, I can tell you that schools closed regularly with less snow than that.  

Another shortcoming is that driving conditions and safety are not necessarily directly related to how much snow falls.  Winter storms are incredibly complicated.  They can include freezing drizzle, freezing rain, sleet, and snow of differing water contents and crystal types.  Road characteristics, such as temperatures, also vary from storm to storm and during storms.  Last year's freezing rain event here in Salt Lake City shows how a very small amount of precipitation can produce extremely hazardous driving conditions.  Conversely, I have driven on rural roads covered by several inches of low density snow with little or no problem.  The timing of the precipitation (e.g., relative to rush hour) and the quality and preparedness of winter road maintenance infrastructure and staffs further contribute to winter storm impacts.  It also doesn't help when our elected officials opt to bury their heads in the sand and ignore the forecast (you know who you are Georgia Governor Nathan Deal).  

Forecasting and communicating all these complexities is a major challenge for the weather prediction enterprise.  In addition, even a good forecast can be ineffective if the end user doesn't understand it, doesn't believe it, doesn't know what to do with it, or doesn't take effective action (see this excellent post on Chuck's Chatter).  Ultimately, good decisions regarding school closures are based on a lot more than just how much snow falls during a storm.  

Sunday, September 25, 2011

Lessons from Joplin Tornado

The 22 May Joplin tornado killed 160 people, the most people killed by a single tornado in the United States.

Source: Army Corps of Engineers
The NWS recently issued a report on the tornado, and there is also a nice article on Andrew Revkin's Dot Earth blog.  Have a look.  Preventing such large losses of life is more than just a meteorological challenge.  Societal, economic, and engineering factors are important contributors and need to be addressed for society to become more weather and climate resilient.

Thursday, August 25, 2011

An Iconic Weather Resiliency Photo

With Hurricane Irene approaching the eastern seaboard today, the CNN blog has a report on their top-five natural weather disaster stories, with some remarkable videos and photos.

The photo below is incredibly remarkable as it encapsulates very well how weather resiliency (or lack thereof), affects the loss of life and property during weather disasters.

Source: CNN/Ray Asgar
When I first saw the photo, I figured it was photoshopped, but the accompanying discussion says that the owners, Warren and Pam Adams, lost their home during Hurricane Rita in 2005 and, when they rebuilt, they put the home on stilts 14 feet above the ground.  When the area was clobbered by Hurricane Ike in 2008, their home was the only one that survived the storm surge and winds.

Another perspective is provided by this ABC news report.


The decisions we have made in the past, and that make today, ultimately affect our vulnerability to natural disasters.