Wednesday, May 31, 2023

A Remarkably Warm May

In the previous post, I commented about the Goldilocks temperatures over the past two weeks.  In my view, they were ideal for avoiding the use of home heating or cooling.  

That said, they were not Goldilocks from a climate perspective. In fact, this May is going to go down as the warmest on record at Salt Lake City.  With one day left to go (today), the average temperature for the month is an incredible 67.1˚F.  That eclipses the prior record set in 1934 of 66.7˚F.  

Source: https://xmacis.rcc-acis.org/

The 67.1˚F will likely go up a bit more today.

I actually found this a bit surprising because there hasn't been any exceptional heat.  However, May has been characterized by relatively little variability in large-scale weather systems compared to normal.  Instead we've simply had sustained warmth.  In the plot below, the range of "normal" (i.e., averages for 1991–2020) is indicated by the green background.  This May, we had only 5 days with a maximum temperature below average and only 4 days with a minimum temperature below average.  

Source: NWSFO

Since I always get questions about the veracity of the airport temperatures, below is a graph of the monthly mean temperatures at Bountiful Bench, with continuous records back to 1975.  With one day left to go, this May rates as the 2nd warmest (63.6˚F) behind only 1992 (63.9˚F).  

Source: https://xmacis.rcc-acis.org/

We will probably end up just behind 1992 at that location (by about 0.1˚F) based on last night's minimum and the forecast high for today.  

Tuesday, May 30, 2023

Goldilocks Temperatures with Thunderstorms

Since about May 12th, we've been locked into what I'll call the large-scale doldrums with relatively weak flow at upper levels and a lack of strong synoptic systems and fronts.  The average 500-mb height analysis for May 12 to May 27 shows the pattern that has predominated quite well with a long-wave trough over the central Pacific, ridge over western North America, and trough over the Canadian maritimes.  

Image source: NOAA/PSL

At the same time, the pattern over Utah and indeed a good chunk of Nevada and the Sierra Nevada has been quite active from a thunderstorm perspective.  The reason for this is the weak short-wave trough that is embedded in the long-wave ridge (indicated by the dashed line above).  Systems have moved through this trough, modulating thunderstorm coverage and intensity, but it has refused to go away.  

As a result, we've seen lightning and thunder on a regular basis in the Salt Lake Valley.  Other than that, there hasn't been much in the way of weather variability, especially for May.  Since May 12 at the Salt Lake City International Airport, minimum temperatures have been at or above 50˚F and maximum temperatures have been at or below 88˚F. 

Source: https://xmacis.rcc-acis.org/

This is pretty much the Goldilocks zone for comfort in the valley, at least at my house where we haven't bothered running the heat or cooling system throughout this period.  If you like to exercise, it's tolerable in the morning and even in the afternoon.  One has just had to dodge the thunderstorms.  

Enjoy.  July will come eventually.  

Wednesday, May 24, 2023

Great Salt Lake Update

The Great Salt Lake at Saltair* rose 4.7 feet from 4188.7 feet on October 1st of last year to 4,193.4 feet on May 1st of this year.  That's a big increase, but it is still very low.  The graph below illustrates the lake elevations at Saltair based on data from the USGS.  The orange line indicates the 4193.4 ft level, showing that the current elevation is still below all but the low stand in the early 1960s, recent seasonal minimums in the fall, and the drawn out low period of the past couple of years.  

Lake elevation at Saltair since 1847 (USGS data)

You may have noticed the asterisk above.  Saltair provides long-term records for the south arm of the lake, but the rock-fill railroad causeway dividing the lake in half can cause elevation imbalances.  Additionally, the berm in a gap in the causeway was raised recently.  As a result, while the south arm receives most of the freshwater runoff and has risen a lot, the north arm has only climbed slightly to 4189.2 ft.

Lake elevation at Saline since 1966 (USGS data)

Landsat imagery from last May and this May shows more water in Farmington Bay, Ogden Bay, and the Bear River Bay.  However, large expanses of lake bed remain exposed in Farmington Bay and on the western side of the lake.  

Source: https://glovis.usgs.gov

We will probably see lake levels rise for a few more weeks.  Below is a bathymetric map of the lake that includes the 4188.7' (historical low), 4193.4' (current), 4195', 4198' (functional low), and 4211' (historical high) elevations.  Perhaps the south arm will get a bit above 4195', although that's really just a guess. on my part. 


Note that the map above assumes a level lake.  Lake elevation, coverage, and shorelines do fluctuate due to wind, inflows, and other effects.   

Anyone want to set the over/under for peak lake elevation at Saltair?

Sunday, May 21, 2023

That's a Wrap

It's never over until it's over, but yesterday was probably my last day of resort skiing for the season.  

It was an unusual last day, with smoked filled skies from the Canadian wildfires.  

Friday night lows at the top of Hidden Peak were only 39˚F, yet there was a solid freeze of the snow on the mountain thanks to clear skies and long-wave radiative cooling.  Regulator was "not recommended" first thing and I can confirm that the ski patrol was on point.  With early sun, Mineral offered up soft skiing quickly due to its easterly and southerly exposures, but I'm always happier when the steeper lines off the tram can be skied.  North Chute and the like with May morning sun exposure began to soften up and ski well around 10:30.  

It will be interesting to see if Snowbird can make July.  There is still an enormous amount of snow on the upper mountain.  Water equivalent at the SNOTEl site, although now well below where we were in 2010/11, is still in the top 10% of snowpacks on May 21 since 1990.  


That said, the warmth of this May has shed about 20 inches of water equivalent at the SNOTEL site, the snowpack is fully ripe, and it is extensively dust covered.  A shift to cooler weather would probably be helpful.  

Thursday, May 18, 2023

Great Salt Lake Bed Dust

 Yesterday evening, while out for a walk, I noticed a wall of dust over the western Salt Lake Valley.  

After returning home, I took a look at a video from the west-facing camera my department operates at the University of Utah and it showed a remarkable plume originating to the north and presumably from the exposed Great Salt Lake bed in what used to be Farmington Bay.


Much has been made about the snowpack, runoff, and rise of the lake.  Indeed, the lake elevation at Saltair Boat Harbor has increased over 4 feet from its record low last fall.  It currently sits at about 4193.3 feet, but that is still remarkably low as can be seen by the elevation graph below for the past 40 years.  


As a result, the lake area remains low and lake-bed is still exposed in many areas, including much of Farmington Bay (east of Antelope Island) which I suspect was the source of yesterday evening's dust (image below from May 15).  

About a month ago, it was anticipated that the lake would eventually rise to 4195 feet with this year's runoff.  That's a big increase, but it is still below what is viewed as the optimal lake zone between 4198 and 4205 feet.  

Friday, May 12, 2023

The Big Melt

Snow is melting and the decline in lower-to-mid elevation snowpack has been impressive.  

The lowest SNOTEL in the Wasatch Range is Ben Lomond Trail in the northern Wasatch (5972').  Snowpack water equivalent has dropped like a stone there from its all-time 47" peak (with records going back to 1981) to 17.1 inches yesterday.  It remains at an all-time high, ahead of 2011, 1984, and 1983.  Based on the forecast, I suspect it will probably make it about another 10 days before becoming snow free.

Source: NRCS

In City Creek Canyon, the low-elevation Louis Meadow site (6700') has also seen an incredible decline from 43.3 to 13.1 inches.  It's now behind where the snowpack was in 2010/11.  

Source: NRCS

A bit higher on Lookout Peak (8161'), the big melt has just begun and has been slower.  Although now behind the 2010/11 snowpack, 45" of water remains.  Streamflows in City Creek are forecast to increase in the coming days as this upper-elevation snowpack begins to melt in earnest.  

Source: NRCS

The Parley's summit snotel has a long period of record going back to 1979.  At 7,585', this site has shed a bit over half of its snowpack and it is behind 2011, 1984, and 1983.  It might have about 10 days of snow cover left.  

Source: NRCS

Finally we have the high elevation Snowbird snotel (9177 ft).  You may recall a blog post from a couple of weeks ago (Snowbird SNOTEL Measurement Oddities) in which I discussed how it strangely climbed and reached a new all-time high.  It appears the NRCS has corrected that provisional data, so the site now shows no record peak.  Melt has not begun in earnest yet, but it has shed a small amount of water and it currently sits behind 2011 and 2005.  Still there is a lot of water to come down from the upper elevations.  

Source: NRCS

By and large, I think the situation right now is perhaps the best we could have hoped for given the enormous snowpack that existed in April.  The runoff has produced some flooding and damage in places, but given the enormous snowpack, we have been able to shed a good fraction of the lower and mid-elevation snowpack while the upper-elevation snowpack on north aspects has been ripening but not releasing a lot of water.  In the Salt Lake area, the worst may be over in terms of snowpack runoff for Emigration Creek, which drains a lower elevation basin, but creeks draining higher elevation basins, like City Creek and the Cottonwoods, have big water to come.  

Thursday, May 11, 2023

Tragedy of the Cottonwoods

A red snake at Snowbird in September

Although it was a great ski season, the reality is that transportation challenges remain ongoing in the Cottonwoods.  The Central Wasatch Commission recently approved its Big Cottonwood Canyon Mobility Action Plan in which they recommend the following

  • Restripe the Big Cottonwood Canyon Park & Ride lot (I have no idea why they included this extremely minor change)
  • Implement a supplementary shuttle in Big Cottonwood Canyon
  • Enhanced bus service with a dedicated transit lane with resort mobility hubs
  • Improvements at the intersection between Fort Union Boulevard and Wasatch Boulevard
  • Tolling, restrictions to canyon on-road parking, and incentivizing bus options
  • Year-round bus service featuring canyon trailhead stops
Additionally, this week UDOT apparently began to float a trial balloon for tolling plans, with media reports suggesting costs for travel would vary, but tolls could be between $25 and $35 per vehicle.  In Little Cottonwood, it's suggested that tolling would be applied above the White Pine trailhead.  It's unclear a this time where tolling would occur in Big Cottonwood.  

None of these recent announcements have given me much optimism for the future.  There are commissions, departments of transportation, transit authorities, and local and state agencies.  There are recommendations and plans, but not a lot of coordination.  Proposals for massive infrastructure (e.g., the Little Cottonwood Gondola) appear to have limited public support.  

This past season, existing bus service was actually cut, substantially.  The UDOT program manager overseeing the Little Cottonwood Environmental Impact Statement (EIS) told the Salt Lake Tribune earlier this year that the $150 million in state funds for tolling and busing could not be accessed until the record of decision for the EIS was issued.  That has not happened yet.  It would then take two years to buy and vet the busses and to advertise, design, and build a mobility hub.  That timeline seems optimistic.  

Beyond the Cottonwoods, recreation in Mill Creek canyon has also exploded in recent years.  In part, this is probably due to traffic in the Cottonwoods.  It really could use a shuttle as well.  

So where does this put us?  It sounds like improved mobility hubs and tolling are probably not going to happen until at least the 2025–26 season.  A gondola?  Who knows.  Are the buses being discussed by UDOT simply to service the gondola or, if the gondola is in a state of flux, will we see an increase in service up the canyons?  Will there be stops at backcountry trailheads?  

I suspect the best thing that could happen in the short term is expanded use of parking reservations at the resorts. Solitude is considering doing this.  That and more snow years with a decent snowpack in the low-to-mid elevations to enable recreation outside the tri-canyons (yes, that's what we used to call Mill Creek, Little Cottonwood, and Big Cottonwood Canyons), which was a real bonus this past season.  

Monday, May 8, 2023

Sunniest Ski Areas?

As much as people like to argue about whether or not ski area snowfall reports are legit, but perhaps there's more to argue about in the "day's of sunshine claim."  

Snow Brains recently published a top 7 list of the sunniest ski resorts in America.  Coming in at #1 was Palisades Tahoe with "more than 300 sunny days per year."

The 300 days of sunshine claim as been around for as long as I can remember.  When I was a kid, walking uphill both ways to school in sub-zero temperatures in upstate NY, I used to read promotional brochures from the Lake Tahoe area claiming more than 400" of snow and 300 days of sunshine and dream about how incredible the skiing must be there.  I mean, it must either be snowing or sunny!  What could be better. 

Source: https://visitlaketahoe.com/ski-and-snowboard/and-the-award-for-the-best-weather-to-ski-in-lake-tahoe

However, there are many things that are puzzling about that number. 

First, it is an annual number.  If you are a skier, you really want to know how often it is sunny during the ski season.  Winter is the cloudiest part of the year in the Tahoe area, whereas summer and early fall are less cloudy. Thus, the annual number is skewed by the seasonality of cloud cover.  

Second, sunny day is not defined.  Does it have to be bluebird all day?  If the sun peaks in and out it that good enough?  What if the mountain is shrouded in fog at the base and clear on top?  

For instantaneous observations, the National Weather Service defines sky coverage based on the opaque cloud coverage "octants" (divisions of eight) below.  

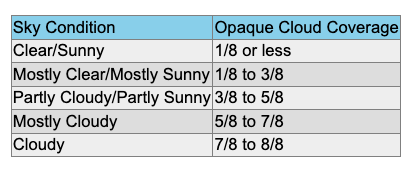
Source: https://www.weather.gov/bgm/forecast_terms

At what coverage does cloudy stop and sunny end? And, since cloud cover varies during the day, how does one deal with variability?  

Finally, what observations are being used?  Most ski areas do not collect sky cover observations and the closest observing stations that do are often at airports and not necessarily representative of what is happening on the mountain.  

I suspect these numbers have simply been cooked up with liberal interpretation of nearby airport observations that are not necessarily representative of on-mountain conditions.  Indeed, about a decade ago the Tahoe Daily Tribune published an article about a Tahoe area resident, David Antonucci, who runs tahoefacts.com and likes to set the record strait on Tahoe-area claims.  As described in the article Mr. Antonucci looked into the 300 days claim and suspects it is based on observations from the Tahoe Valley Airport. 

“I think where it came from is, at the Tahoe Valley airport, they used to make sky observations. So, I had some records from 21 years of observations that if you multiplied it all out it comes out to about 300 days. And I think what’s said there is there’s 300 days in which there is some sunshine. But I was also able to find probably actually a little bit better statistics. I went to a document called the Climate Atlas of the United States and it has the total number of hours of sunshine in a particular area. So, here at Lake Tahoe we have 4,446 hours of daylight each year and, of that time, at least 3,400 hours there’s sun shining, so that works out to 76 percent. Seventy-six percent of the time during the daylight hours the sun is shining, on average, is probably a better way to say it. You say ‘300 days,’ you think, ‘Oh, that was a day which is all sunny all day long,’ and it may not have been; it may have been sunny part of the day and then cloudy. I was not able to find much in the way of any data speaking to actual days of sunshine or cloudy weather, but for our region it’s probably not too far off. Reno has 251 days of clear and partly cloudy weather, Blue Canyon has 238 days of clear and partly cloudy days, so you can see it’s possible that Tahoe is higher, maybe under 300. It seems like it could be a reasonable number, but it should not be interpreted as that’s a whole day of just sunshine and no clouds.”

So, if 300 days of sunshine seems too good to be true, that's because it is.  

This isn't to say that the Tahoe-area resorts, and other Sierra resorts like Mammoth don't get a lot of sunshine compared to many other areas.  They might even be the sunniest resorts.  However, the 300 days claim is inflated. 

Friday, May 5, 2023

LCC Gondola Plans and Avalanches

In the wake of this season's historical avalanche cycle, I was curious about the resilience of the proposed Little Cottonwood gondola to such an assault.

I haven't located gory details, but a basic summary is found on page 2-48 of the Little Cottonwood Canyon Environmental Impact Statement, Vol. 1.  I had assumed that they would locate towers outside of avalanche paths, but that apparently was not possible.  Instead, the report says that gondola alignment and towers avoided avalanche paths to the extent feasible.  Otherwise, the towers would be designed to be stronger and taller, the latter for cabins to avoid the powder blast.

Source: https://littlecottonwoodeis.udot.utah.gov/wp-content/uploads/2022/08/LCC_FEIS_Volume1.pdf

This season illustrates that this is a critical aspect of the gondola plans.  I obtained the image below from the Little Cottonwood Canyon Alternative Interactive Maps web site.  It shows the location of the angle station and, with a green square, two tower locations. The one up canyon from the angle station is tower #9 and it is located in the Tanners slide path.  


The Tanners path ran big and destructively this year.  Below is a photo of it that was taken late this season and generously shared with me by Joel Pavek. My best guess of the tower position is indicated by the green square. 


I'd be curious to hear how this and possibly designs for towers in other paths might have fared during this season's onslaught.  Were the original plans sufficient for the forces generated this year, or will redesign be needed?  

Below is an example from New Zealand of why this is important. 

Tuesday, May 2, 2023

Gordon Lightfoot (1938–2023)

Gordon Lightfoot died yesterday at the age of 84.  The Canadian singer-songwriter wrote one of the greatest weather related songs of all time, "The Wreck of the Edmund Fitzgerald."

It was, in fact, one of the first two records that I bought as a kid, and the 45 looked exactly like the one below.  The yellow-orange label is seared into my synapses.

What role it played in my eventual career path is unknown, but I loved the song and probably love it even more today.  The lyrics are historical, haunting, poetic, and powerful.

The legend lives on from the Chippewa on down
Of the big lake they called Gitche Gumee
The lake, it is said, never gives up her dead
When the skies of November turn gloomy
With a load of iron ore twenty-six thousand tons more
Than the Edmund Fitzgerald weighed empty
That good ship and true was a bone to be chewed
When the gales of November came early

The ship was the pride of the American side
Coming back from some mill in Wisconsin
As the big freighters go, it was bigger than most
With a crew and good captain well seasoned
Concluding some terms with a couple of steel firms
When they left fully loaded for Cleveland
And later that night when the ship's bell rang
Could it be the north wind they'd been feelin'?

The wind in the wires made a tattle-tale sound
And a wave broke over the railing
And every man knew, as the captain did too
T'was the witch of November come stealin'
The dawn came late and the breakfast had to wait
When the gales of November came slashin'
When afternoon came it was freezin' rain
In the face of a hurricane west wind
When suppertime came, the old cook came on deck sayin'
"Fellas, it's too rough to feed ya"
At seven PM, a main hatchway caved in, he said
"Fellas, it's been good to know ya"
The captain wired in he had water comin' in
And the good ship and crew was in peril
And later that night when his lights went outta sight
Came the wreck of the Edmund Fitzgerald
Does any one know where the love of God goes
When the waves turn the minutes to hours?
The searchers all say they'd have made Whitefish Bay
If they'd put fifteen more miles behind her
They might have split up or they might have capsized
They may have broke deep and took water
And all that remains is the faces and the names
Of the wives and the sons and the daughters
Lake Huron rolls, Superior sings
In the rooms of her ice-water mansion
Old Michigan steams like a young man's dreams
The islands and bays are for sportsmen
And farther below Lake Ontario
Takes in what Lake Erie can send her
And the iron boats go as the mariners all know
With the gales of November remembered
In a musty old hall in Detroit they prayed
In the maritime sailors' cathedral
The church bell chimed 'til it rang twenty-nine times
For each man on the Edmund Fitzgerald
The legend lives on from the Chippewa on down
Of the big lake they called Gitche Gumee
Superior, they said, never gives up her dead
When the gales of November come early

The song was six minutes long, yet you always wanted to know more.  The causes of the shipwreck remain unclear with many hypotheses proposed, although wind and waves were a contributor. Modern analysis and modeling tools have been used to describe the meteorology that led to the tragic loss of life, indicating peak gusts above hurricane force and waves higher than 20 feet (see Hultquist et al. 2006).  Surface analyses of the event show the passage of an intense extratropical cyclone, with Lake Superior in the intense pressure gradient to the southwest of the low at 0000 UTC 11 November (lower right image).  The ship was lost about 15 minutes later.

Source: Hultquist et al. 2006

In many ways, it resembled a powerful oceanic cyclone.  Norwegian meteorologist refer to that region of of a deep cyclone as the poisonous tail of the bent-back occlusion due to the hazards posed for mariners.  It can feature what meteorologists call a sting jet, which wraps around the low center and descends to the surface.  

The song has inspired many meteorologists, if not to enter the field, then to ponder the meteorology of the event.  

Rest in peace Gordon Lightfoot and those who perished in this tragedy.  

Monday, May 1, 2023

Snowbird SNOTEL Measurement Oddities

Those of you keeping score at home know that through last week, the Snowbird SNOTEL had still not eclipsed the peak snowpack water equivalents reached in the 2005 and 2011 water years.  

However, things changed over the weekend.  

On April 26th, the snowpack water equivalent was 72.3", the highest of this season, but a shade lower than the 75.1" reached on two dates in 2001 and the 74.6" peak in 2005.  However, from April 26th to 30th, the snowpack water equivalent rocketed upwards to 76.2", a new record.  

Source: NRCS

How did this happen?  Certainly not from snowfall, as the last storm was on April 25th and would have been accounted for by the measurement on the 26th.  The 26th was a spectacular day with great skiing in the wake of that storm and on the 27th the site recorded 72.0", just a shade lower than the 26th.  Then from the 27th to the 28th the measurement jumped to 75.2", despite there being no significant precipitation.  The 27th was a very windy day and perhaps the wind deposited snow over the pillow.  However, it went up even further to a peak of 76.2" on April 30.  How could this happen?  

SNOTEL stations measure snowpack water equivalent using a snow pillow with a pressure transducer.  The snowpack weight of the snowpack presses down on the pillow, resulting in pressure reading that can be converted to a water equivalent.  

Source: NRCS

The pillow, however, simply measures pressure.  It doesn't say anything about where that pressure came from.  Increases could be due to snowfall adding weight to the snowpack, but also other factors like wind transport adding to the snowpack over the pillow, or water moving horizontally through the snowpack during melt periods. A strong layer in the snowpack can also result in bridging, with the snow above the bridge not fully contributing to the weight of the snow.  If the bridge weakens, then there can be an increase in measured water equivalent.  

Snowbird isn't the only location showing this behavior.  Lookout Peak jumped 2" from April 26 to April 28 before dropping a bit through today.  That increase, not associated with precipitation, also pushed Lookout Peak to a record snowpack water equivalent.  

Source: NRCS

Those are a couple of the curious measurement oddities evident over the past couple of days and a reminder that SNOTEL time series are not just a reflection of precipitation or melt.  

That said, we can also have a look at stations where the snowpack has ripened (i.e., warmed to the melting point through the entire depth of the snowpack) and net melting are occurring.  A good one is Parleys's Summit.  On April 28th, snowpack water equivalent was 32.9" and in 3 days it has dropped over 5" to 27.7".  The decrease yesterday was 2.2".  Pretty impressive for the last day of April. 

Source: NRCS

With a warm night last night, a decent amount of sunshine, and another day near or above record highs,  expect the impressive snowmelt to continue at Parley's and other areas where the snowpack is ripe.  

Addendum 2 May 2023:

NRCS appears to have done some quality control of the Snowbird data. When I pulled it up this morning, the big increase was reduced and values were below the 2011 water year maximum.  

Source: NRCS