
The Great Salt Lake at Saltair* rose 4.7 feet from 4188.7 feet on October 1st of last year to 4,193.4 feet on May 1st of this year. That's a big increase, but it is still very low. The graph below illustrates the lake elevations at Saltair based on data from the USGS. The orange line indicates the 4193.4 ft level, showing that the current elevation is still below all but the low stand in the early 1960s, recent seasonal minimums in the fall, and the drawn out low period of the past couple of years.
 |
| Lake elevation at Saltair since 1847 (USGS data) |
You may have noticed the asterisk above. Saltair provides long-term records for the south arm of the lake, but the rock-fill railroad causeway dividing the lake in half can cause elevation imbalances. Additionally, the berm in a gap in the causeway was raised recently. As a result, while the south arm receives most of the freshwater runoff and has risen a lot, the north arm has only climbed slightly to 4189.2 ft.
 |
| Lake elevation at Saline since 1966 (USGS data) |
Landsat imagery from last May and this May shows more water in Farmington Bay, Ogden Bay, and the Bear River Bay. However, large expanses of lake bed remain exposed in Farmington Bay and on the western side of the lake.
 |
| Source: https://glovis.usgs.gov |
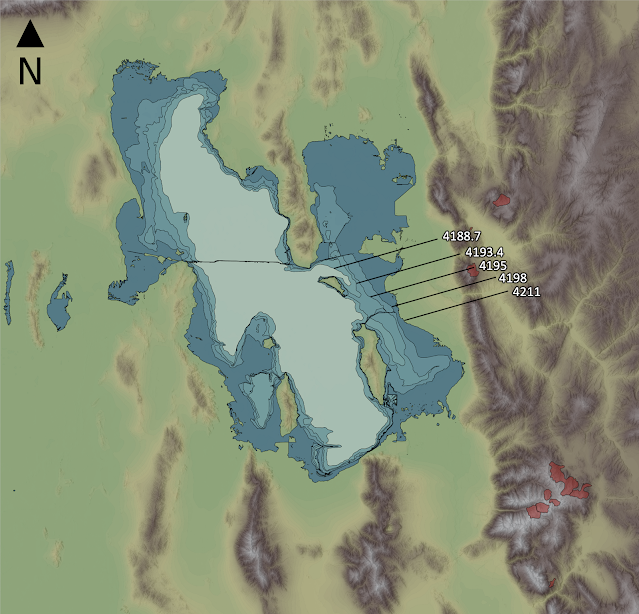
Note that the map above assumes a level lake. Lake elevation, coverage, and shorelines do fluctuate due to wind, inflows, and other effects.
Second edition delivered today! Looks good.
ReplyDelete