Introductory meteorology textbooks depict a world of cold front, warm fronts, and occluded fronts. The cold front separates two airmasses, one the colder "polar" airmass, the other the warmer "tropical airmass." The cold front is a long-lived feature in that intrudes into the warmer airmass, lifting it and producing a band of heavy precipitation. Chance are you have seen conceptual models of this type.
If only the world were so simple.
The reality is that the atmosphere is a dynamic, complicated place in which troughs, fronts, and other atmospheric features are constantly evolving. You can't put a line on a map in one area and expect it to move continuously, without evolution into another. The developing storm for tonight and tomorrow is a prime example. There are a lot of moving parts, to take this discussion for what it's worth: A summary of a complicated atmosphere.
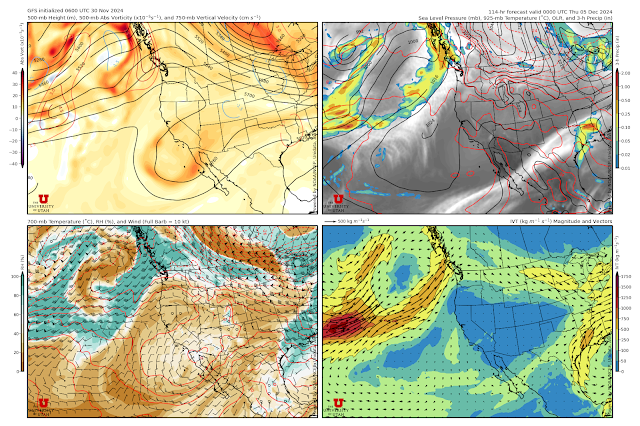
The GFS forecast valid at 1200 UTC 26 November (0500 MST Tuesday) is below. I've identified some of the primary large-scale features of concern for the forecast. The first is an atmospheric river (AR), characterized by an elongated filament of high integrated vapor transport (IVT) above 250 kg/m/s, that extends from the eastern Pacific across southern California and southern Utah. The second is an upper-level trough at 500 mb (dashed line upper left) and 700 mb (dashed line upper right). There is another also a developing trough downstream of the Sierra Nevada, evident at 700 mb, which I've identified with a solid line at lower left.

Below is the total precipitation produced by the High Resolution Rapid Refresh (HRRR) through this time (0500 MST Tuesday) early tomorrow morning just to highlight the higher precipitation amounts tonight in the central mountains. From Provo north, precipitation is heaviest around Provo Peak, Cascade Ridge, and Mount Timpanogos. By and large, this reflects the position of the strongest IVT accompanying the AR over southern Utah.
Precipitation over the Salt Lake Valley though is fairly limited. During this period, drier air fills the valley at low levels and causes precipation sublimation or evaporation. Eventually we get some precipitation, but it will largely be a "cloud storm" or "virga storm" tonight.
By 0300 UTC 27 Nov (8 PM MST Tuesday), the AR has "penetrated" across the Rockies and into the central US. In this case, don't think of the leading edge of the AR as a material surface. The IVT across the southern Great Plans was already close to AR level earlier and the strengthening IVT in that part of the world led to IVT values ≥ 250 kg/m/s rapidly extending all the way to eastern Missouri.
Meanwhile over the Great Basin the trough downstream of the Sierra has acquired frontal characteristics. This occurred ahead of the approaching 700-mb trough, as depicted in the lower left-hand panel below. This is an example of discrete frontal propagation in which a new front forms ahead of the approach 700 mb trough, as often happens over the Great Basin.
With this front moving through, precipitation over the Salt Lake Valley becomes more widespread, as indicated by the 6-h accumulated precipitation forecast valid 0300 UTC 27 Nov (8 PM MDT Tuesday).
By 1500 UTC 27 November (8 AM MST Wednesday) we are well behind the front and 700mb trough, which have merged into one feature that extends from California into the southern Great Plains. At this time, mountain precipitation would be associated with unstable, postfrontal, northwesterly flow (a bit being produced by the GFS is in the red circle).
So, there's a lot going on. True AR conditions remain to the south of the Wasatch during this period, although we will get some mountain snow on the fringes of it. Then we have the frontal passage late Tuesday and Tuesday evening, and the post-frontal period Tuesday night into Wednesday.
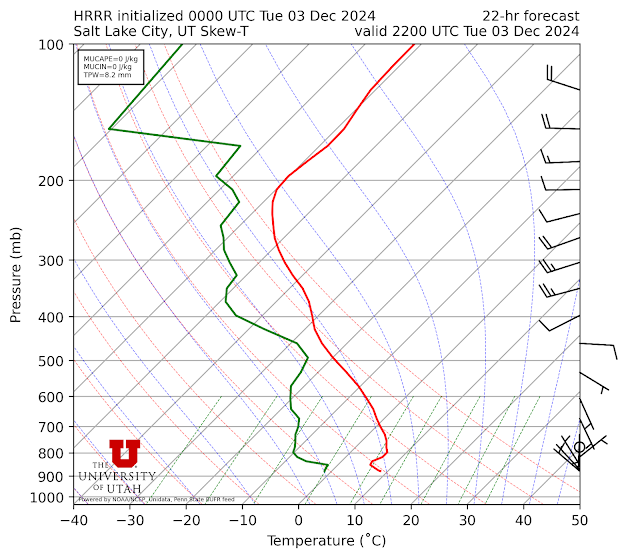
Let's look at some totals from the models. The HRRR is generating 1.79" of water and 19.3" of snow. The first part of the storm is relatively warm, with the wet-bulb zero level reaching about 7500 feet early Tuesday morning (call it a 6500-7000 foot snow level give or take at that time) before it falls late Tuesday into Wednesday with the frontal passage. Snow through mid day Tuesday looks to be relatively high density (snow-to-liquid ratios between 8 and 11 to 1 at Alta Collins), after which we transition slowly into lower density snow.
The GFS (not shown) is one of the drier models, putting out only 0.84" of water and 11" of snow.
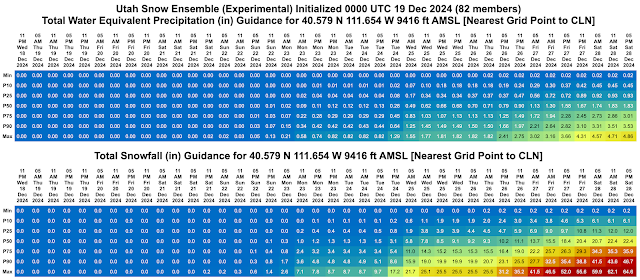
Below is a plan-view plot from the Utah Snow Ensemble for the total accumulated snowfall through 1200 UTC 28 Nov (5 AM MDT Thursday, although most of this falls through Wed evening). The mean of the 82-member ensemble is at upper right, minimum lower left, and maximum lower right. The mean for Alta-Collins is about 16", with a minimum of 8" and a maximum of 27".
The large contrast between the low-end models and the high end models at this stage is a bit ulcer inducing. The HRRR at 19.3" is nearly double the GFS at 11". I'm inclined to be cautious in a situation like this and lean toward a storm total of 12–24" at Alta Collins. That means this will likely come in as the biggest storm of the season so far. It will help a lot, but probably not be truly transformative. A best case scenario would be for the AR to shift a bit northward and for the post-frontal period late Tuesday night and Wednesday to be highly productive.