Friday, September 30, 2022

Avenues 1, Everyone Else 0

Excuse the gloating, but yesterday's thunderstorms favored for once my are with the Avenues, downtown Salt Lake, and the University of Utah coming in with the highest precipitation totals in the Salt Lake Valley. 

Observations for the 24-hour period ending this morning show several sites reporting accumulations of around 0.3 inches.  

Source: MesoWest

Multisensor precipitation estimates of 24-hour accumulated precipitation show a band of precipitation extending from West Valley City across the Salt Lake Valley and into the Avenues Foothills.  This pattern primarily reflects three thunderstorms systems that developed and intensified in the southwesterly flow as they moved across the northern Salt Lake Valley.  The heaviest precipitation was actually in the mountains northeast of Salt Lake City.  

Source: https://mrms.nssl.noaa.gov/qvs/product_viewer/

The first system moved across the northern Salt Lake Valley from about 4:30 to 5:30 PM MDT, interrupting my mountain bike ride through the avenues foothills.  I just barely beat it back to the house.  The second moved across the valley from from about 7:30 to 8:30 PM MDT.  The third developed over downtown Salt Lake City at around 8:50 PM MDT and moved into the Wasatch Range by around 9:15 PM MDT.  As can be seen in the precipitation analysis above, there were a few other cells in other areas that developed and moved northeastward in the southwesterly flow, including one that moved across the Great Salt Lake and affected the Ogden area.  

Thanks Mother Nature.  My plants appreciate it.

Thursday, September 29, 2022

UTA Ski Service Cuts

 UTA announced yesterday major cuts to ski bus service for this coming winter.  For the Cottonwoods:

  • Route 953 up Little Cottonwood is suspended
  • Route 972 up Big Cottonwood cut from 15-minute to 30-minute service
  • Route 994 up Little Cottonwood cut from 15-minute to 30-minute service.
A full description of cuts (or what they call "adjustments") is at https://www.rideuta.com/Rider-Info/Ski-Service.  Below is a screenshot from that site, discussing their explanation for these service cuts. 

There are a few other cuts in service on non-ski routes (see https://www.rideuta.com/Rider-Info/Change-Day).  In Salt Lake county, four non-ski routes will see service frequency reductions.  

I hereby declare Joni Mitchell's song Big Yellow Taxi the official song of the Central Wasatch.  "Don't it always seem to go that you don't know what you've got until it's gone."

Sunday, September 25, 2022

Bonus Season

Call it Fall if you want to, but what I like to call the "bonus season" is upon us as a ridge in late September and October makes for beautiful weather, cool mornings, and sparkling afternoons.  Add the changing leaves and you have simply spectacular weather for mountain biking, hiking, or any other outdoor pursuits that don't require snow or ice.  


Reds, oranges, and yellows are now dotting the Corner Canyon area and temperatures are near ideal for a steady morning climb.  

It's bittersweet to ride in the Corner Canyon area knowing that expansion of trails in the Avenues foothills remains paused.  Corner Canyon has a great trail network, with a mixture of hiking trails, mixed use trails, and downhill bike flow trails. 

I'm old enough to remember riding there on the old ATV and jeep trails before there was development.  Those trails have now been supplemented with better engineered single track trails, greatly expanding the riding and hiking potential.  I look forward to seeing the trails proposed for the Avenues foothills finished and hope it happens sooner rather than later. 

Thursday, September 22, 2022

Storm Peak Lab Field Research Experience

I understand I've missed some exciting weather in northern Utah, but I have been in Steamboat Springs this week teaching an immersive course in mountain field research at Storm Peak Lab with Drs. Gannet Hallar and Sebastian Hoch.  We brought 14 graduate students here thanks to support from the National Science Foundation.  

Hungry students after the long drive to Steamboat

Storm Peak Lab is a mountaintop observing facility that has operated at one location or another near the top of Steamboat Springs Ski Area for more than 40 years.  The current facility was constructed in 1995.  The University of Utah recently took over operations of the lab from the Desert Research Institute.  


Inside and attached to the lab are a bevy of chemical, aerosol, biological, and microphysical instruments to better understand everything from regional air quality and pollution to mountain precipitation processes.  We spent two days at the lab learning about the instruments, planning field activities, and discussing topics such as field-program safety, inclusivity in science, and even how to take effective field notes (this sounds like a yawner but is really important!).  

We also spent time in the field.  Prior to leaving for Steamboat, the students planned a number of field activities to examine mountain weather phenomena.  Then the big monsoon surge forced us to do some pivoting and adapt, which is not unusual in meteorological field work.  We had a couple of sessions using a wind LiDAR, an instrument that can scan like a radar, but uses a laser to detect winds in clear air.   The lidar is pictured below with some of the students and a picturesque rainbow!


Ideally, the lidar is operated when it is dry (the laser does not penetrate well through precipitation and clouds), but we had enough breaks to sample some cool phenomenon, including a cloud waterfall this morning as cooler air penetrated across the ridge pictured behind the students in the photo above.  

Some of the students worked with one of our techs to develop two mobile mesonet facilities, one that attaches to our department truck and another that can be mounted on a vehicle with magnets.  They were able to drive these vehicles from low to mid elevations to sample the thermodynamic (temperature and moisture) structure and dissipation of a fog-filled nocturnal cold pool that developed over the Yampa Valley south of Steamboat on Wednesday morning. 

We've also had students looking at black carbon, which is emitted, for example, by coal fired power plants upstream of Storm Peak Lab, and attending the Yampa Basin Rendezvous, which has also been going on this week and is examining water resiliency in the Yampa Basin.  Finally, there are three students from my class who could not attend as they are participating in another field campaign in the Cape Verde Islands off the coast of Africa.  These students will be examining how the topography of those islands affects cloud and precipitation development.  

The entire week has been a great learning experience for students and instructors.  I hope to be able to incorporate such activities into future classes.  

Friday, September 16, 2022

Downstream Disruptor

Pretty exciting stuff happening right now over the north Pacific and Bering Sea where a powerful cyclone is disrupting the jet-stream level flow with implications for the weather of the western continental United States.  

Understanding the event requires going back in time to 0000 UTC 14 September (6 PM MDT Wednesday 13 December).  At this time, tropical storm Merbok was moving poleward (identified below with an L) and about to interact with a trough in the mid-latitude westerlies (red dashed line).  

These two features got together and decided to "go off."  With an assist from the upper-level trough, Merbok underwent what is known as extratropical transition, evolving from a tropical storm into a extratropical cyclone of the type found in the mid and high latitudes.  It also deepened explosively to remarkably low pressures.  At 0600 UTC 16 Sep (Midnight MDT last night), the cyclone was centered in the western Aleutians (L in the figure below) with a central pressure of 948 mb (average sea level presure is 1013 mb).  Storms like this tend to disrupt the jet-stream level flow by building a downstream ridge that can initiate a process known as downstream development in which downstream features also amplify. Indeed, the cyclone built a strong ridge over the Bering Sea and strengthened the northerly jet downstream over Alaska.  

Subsequently, forecasts indicate that the ridge will broaden and move slowly downstream while the northerly jet "carves out" a deep upper level trough off the coast of California. 

Another perspective is provided by the loop below.

Indeed, the trough developing off the coast of California will be an important weather-maker for the Golden State this weekend and early next week as it "digs" off the west coast and the associated low level frontal system moves slowly onshore.  Below is the GFS forecast for 1500 UTC (0900 MDT) Monday showing frontal precipitation over central and northern California.  

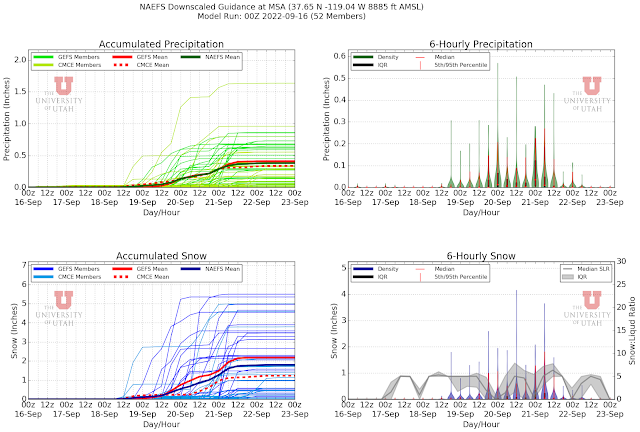
I've been watching this situation closely as my son is backpacking the southern John Muir Trail during this period.  It's hard to say if he might be dealing with significant snow prior to his planned exit on Tuesday.  The frontal precipitation either never makes it to the far southern Sierra or produces only a an inch or two of snow in many ensemble members, but there are a few that produce several inches of snow.  Below is the NAEFS plume for Mammoth Mountain (8885 ft) showing about 1/3 of the members producing 2-6 inches and the other 2/3 2" or less.  He'll be south of Mammoth, so I'm hoping he's dealing with scant snowfall amounts.

Tuesday, September 13, 2022

Prelude of Petrichor

I woke up this morning to the smell of rain, or what is known as petrichor.  The UK met office has a nice web page explaining the origins of the word and what causes the smell.  It says,

"Raindrops landing on dusty or clay soils trap tiny air bubbles on the surface which then shoot upward — as in a glass of Champagne — and burst out of the drop throwing aerosols of scent into the air where they are then distributed by the wind."

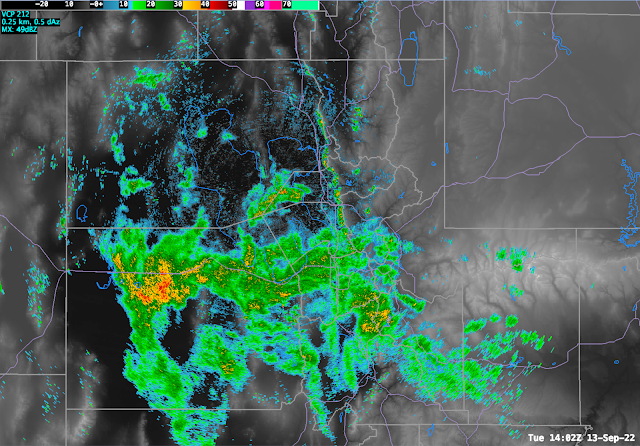
Radar imagery at 1402 UTC (8:02 AM MDT) showed showers over portions of northern Utah, some likely heavy, especially in the West Desert. 

I'm quite glad to see this as although we had an active monsoon for part of the summer, the last couple of weeks have been hot and bone dry.  On the other hand, there are concerns about flooding produced by heavier downpours.  

The HRRR suggests that in the Salt Lake Valley we may see more isolated to scattered showers for a time today before things pick up again in the afternoon.  We'll see if that plays out.  Below is the forecast for 2100 UTC (3 PM MDT) this afternoon when the next area of heavier precipitation with embedded cells is moving north-northeastward through the Salt Lake Valley.  

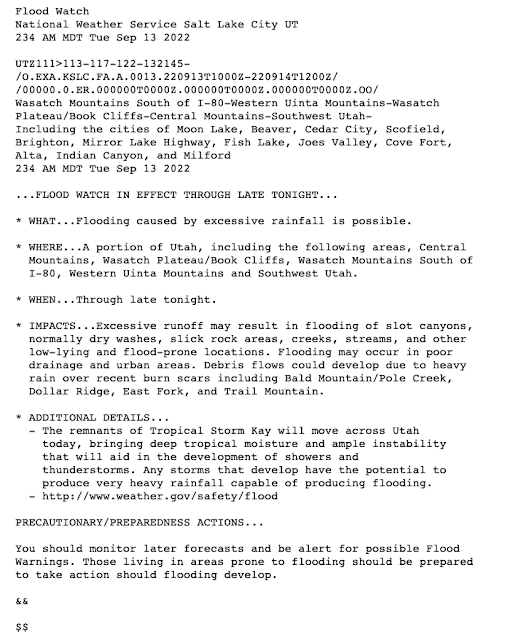
Although we can't count on the details of a forecast like this verifying given the chaotic nature of convective showers and thunderstorms, keep an eye to the sky today as there's a pretty good chance you're going to see something.  The NWS has issued a flood watch for some areas of northern Utah, which I've reposted below.  

Monday, September 12, 2022

Testing

Tomorrow looks to be a day of change for northern Utah, one that might even bring....wait for it...rain!  

We haven't had rain around here so far in September.  The last measurable precipitation at KSLC was on August 19th.  I've lost several perennials in this stretch.  They just seem to have given up.  

Below is a test to see if blogger can deal with an animated png.  If it works, you'll see a loop of the HRRR forecast over a 48-hour period through 1200 UTC Wednesday, with shower and thunderstorm activity spreading into northern Utah.  

If it doesn't, you'll see a static image for this (Monday) morning at 1200 UTC with an area of precipitation over northern Arizona and southern Nevada.  If that's the case, it also means I have some more work to do to figure out how to animate our new graphics for this blog.  

Friday, September 9, 2022

New GFS Products

I could summarize the remarkable 7-day run of temperatures during the first week of September or the push of smoke into northern Utah to add insult to injury, but let's talk about something positive for once.  

This week, I finished what I'll call phase one of upgrades to the graphics on weather.utah.edu.  This has been a heavy lift.  Many of the graphics on weather.utah.edu were produced by software I developed in 2002–2003, especially those for plotting the HRRR, NAM, and GFS.  Back then, I wasn't an old manager like I am today.  I could still code (using the languages of the time).  To do this most recent upgrade, I had to basically learn to code again, this time in Python, dealing with all of the ugliness of meteorological data formats, kludgy python functions, and multiprocessing. 

As is often the case, now that I'm done, I could probably rewrite everything much more succinctly and efficiently, but it's now good enough for government work. 

The HRRR and GFS-13-km products were updated and expanded over the summer, so this most recent upgrade involved updating the products generated from the GFS quarter degree grids (the 13-km GFS grid has a limited number of variables precluding use for many diagnostics).  I've designed these products mainly for teaching synoptic meteorology, but they can be useful for forecasting.  Below is a somewhat techy summary of the products now available under the GFS-0p25deg tab in the left-hand navigation bar.

Synoptic Diagnostic

This is a four-panel plots that includes basic synoptic-scale fields.  

Upper left: 500-mb heights, 500-mb absolute vorticity, and 750-mb vertical motion.  The latter is smoothed to remove smaller-scale waves (known as gravity waves) and illustrate the large-scale vertical motion important for the development and decay of cyclones and large-scale precipitation systems.  

Upper-right: Sea-level pressure, 925-mb temperature, a proxy for infrared satellite imagery, and 3-h accumulated precipitation.  The 925-mb temperature is for about 750-m above sea level (extrapolated below ground over the west) and good for illustrating the location of fronts, especially over oceanic areas.

Lower left: 700-mb RH, wind, and temperatures.  The 700-mb level is widely used for forecasting in the interior western U.S. as it is near mountaintop level, although I'm using it for plots in all regions.

Lower right: Integrated vapor transport magnitude (color fille) and vectors.  I'm pretty excited about this product as I've wanted something better than what is available elsewhere on the web which often does not properly account for topography in the IVT calculation (I'll avoid the details).  This does.  In the above plot, you can clearly see the effects of Tropical Storm Kay over SoCal.  

The synoptic diagnostic is available for the "Supernational West" (a big view of the western Continental United States), Supernational Central, Supernational East, western Continental US, Intermountain West, Europe, Greater Alpine region, Japan, and South America.  Yes, you know why some of those are there.

DT and Surface Diagnostic

This is a two-panel diagnostic designed for teaching concepts in large-scale dynamic meteorology.  

Top Panel: This is an analysis of potential temperature, wind vectors and wind speed on the dynamic tropopause, or DT for short.  The DT separates the troposphere (or lower 80% or so of the atmosphere) from the much more stable stratosphere.  These maps are extremely useful for understanding the jet-level flow (the jet stream is usually strongest at the DT), including the evolution of upper-level troughs and ridges and their influence on surface pressure systems.

Bottom Panel: Same as the upper-right synoptic diagnostic, but reproduced here for convenience.

This diagnostic is available for the Supernational West, Supernational Central, Supernational East, western Continental US, Europe, Japan, and South America.  I'm skipping the smaller domains as this is more of a large-scale diagnostic.

DT Theta (and DT Pressure) Diagnostic

The DT Theta is a hemspheric scale (northern or southern) analysis of the dynamic tropopause potential temperature, wind speeds (showing the jets), and sea level pressure. I've developed this for teaching large-scale dynamical concepts as well. DT Pressure is pretty similar but plots pressure rather than potential temperature (not shown).  

500 hPa Heights

For traditionalists, this is a hemispheric product showing the 500-hPa (or 500-mb) heights and wind speeds (hectoPascals is the official unit of science, although in conversation I use millibars because it rolls of the tongue more easily).

Also available under the GFS-0p25deg tab are time-height sections and soundings.  These, however, are produced from a special data format, known as BUFR, that is based on direct output from the GFS at the nearest gridpoint to the site with the finest detail possible in the vertical.  They only go to 180 hours, as that's the limit of this data format, but that's plenty (see New GFS Soundings and Time Heights for more information).    

A few things have gone away.  I've gotten rid of some regions that I rarely used, the old "convective diagnostic" used for diagnosing thunderstorms and related severe weather, and a couple of oddball products that I wasn't using much.  I would like to eventually put together a proper convective diagnostic again, but lack the time at the moment.  

I have a few other fish to fry in this area, but it may be a while.  The main priority now is to move to "version 2.0" of our Little Cottonwood Forecast Product.  That new version will be an improvement over the old in a number of ways.  First, it is based on the GFS BUFR data for Alta, so it will be produced much faster and with greater reliability than last winter.  Second, many of the variables (e.g., temperature, wind) are based on training with three winters of observations and GFS forecasts, rather than just two.  Finally, we are hoping to plop in a new and better snow-to-liquid ratio algorithm.  It is that last part that we are still testing and evaluating.  Stay tuned.

Thursday, September 8, 2022

Biases in the Interpretation of Weather and Climate Observations

Placing this week's heat wave into context raises all sorts of questions concerning the veracity of weather observations, including extremes and long-term trends.  The relatively high maximum temperatures at the Salt Lake City International Airport have really cast a spotlight on this.  In fact, yesterday the National Weather Service did some measurements in the surrounding area.  They posted a complete summary thread on twitter that you can access beginning with the tweet below.


The long and short of it is that the area south of the airport is a very hot place.  They found good correspondence between multiple measurements in a dry grass field to the south and the observing site.  Kudos to them for doing this.  There may be few if any meteorologists at the forecast office there who are responsible for the current site and they are doing the best they can to ensure that it records reliable observations.  

Now let's move to a related point concerning biases in the interpretation of weather and climate observations.  Such observations are used for all sorts of applications, from severe weather warnings to long-term climate trends.  I will posit here that there are three kinds of biases in the interpretation of such observations:

1. Instrumentation bias.
2. Representativeness bias.
3. Human bias.

Sometimes #3 is a bigger problem than the first two.  

Instrumentation bias is due to the instrument itself, or the recording and processing processes.  This is especially important for extremes.  The sampling frequency and averaging intervals, for example, can affect the recorded maximum.  I believe NWS maxima are based on a 5-minute average, although I'm not sure what the sampling interval is.  Other instruments may do things differently.  There can be other challenges related to the ventilation of the instrument (radiation shielding and ventilation are really critical for measuring daytime temperatures).  For example, some weather stations in use in the Wasatch Mountains by ski areas are aspirated by the wind and are poorly ventilated when the winds are light, leading to erroneously high temperatures.  

Even if you have an instrument that measures temperature (or some other variable like wind) perfectly, it is essentially a point measurement.  We live in a complicated world, and there can be a lot of spatial variability.  Representativeness bias concerns how representative the observation is of the surrounding area.  The airport, for example, is a hot spot.  During this heat wave, it has reported maximum temperatures 2-4˚F higher than the surrounding stations.  This could be partly related to instrumentation bias, but for this discussion, lets just assume that's a representativeness bias.  On the opposite end are observations collected near the golf courses, which have been considerably cooler than surrounding stations.  The area over which a station might be representative can vary a lot depending on factors like the land-surface or terrain variability.  A wind observation at the mouth of Parley's Canyon, for example, is representative of a very small area.  You move a kilometer to the north or south and you are in an entirely different wind regime.  

Finally we have human bias.  As I said, this can be a bigger problem than the first two.  For weather forecasting, meteorologists must learn to sip from a firehose of information.  This involves making a lot of mental shortcuts.  This can lead to heuristic biases that can sometimes lead to forecast errors.  Similarly, interpretation of climate trends and contexts can affected by such biases.

Human bias in this instance is a compound bias comprised of many biases.  I will steal liberally from Ian McCammon's FACETS acronym for heuristic traps in recreational avalanche accidents.  FACETS summarizes six key heuristic traps that affect backcountry decision making: Familiarity, Acceptance, Consistency, Expert Halo, Tracks/Scarcity, and Social Facilitation.  

Familiarity: In backcountry skiing, parties tend to make riskier choices in familiar terrain. Meteorologists, however, may develop familiarity with observing sites, and this affects their interpretation of data from those sites.  It might, for example, cause them to dismiss an unusual observation because it doesn't fit with their prior experience.  I have done this many times.

Acceptance: Many meteorologists want to be accepted by colleagues as much as backcountry skiers want to be accepted as members of their parties!  If everyone else thinks that an observation or interpretation is correct, you may think so too.  There can also be an anti-acceptance bias in which the meteorologist likes to be a contrarian.  

Consistency: In backcountry travel, this is commitment to an objective.  In meteorology, it might be commitment to a prior forecast or a hypothesis.  When you have been pushing a forecast or arguing for a hypothesis for a long time, it is really hard to change course.

Expert Halo: In backcountry skiing, novices sometimes follow leaders into dangerous situations as they acquiesce to the decision making of a more experienced leader (even guides are not infallible).  Similarly, there is a tendency to give greater credence to more established scientists or forecasters. 

Tracks/Scarcity: This is a tough one to translate to meteorology.  In the backcountry, people may take on more risk if they are competing with others for tracks.  Tracks might not be the right word, but in this latest heat wave, I have seen examples of disinformation due to people rushing to announce records that had not been validated.  

Social Facilitation: It's hard to go against the group, in the backcountry or in meteorology.  On the other hand, sometimes the group is right. 

Scientists are humans too and our biases are real.  On the other hand, the scientific method and processes are designed to minimize these biases and slowly but surely approach a better result or theory.  Feel free to add some additional perspectives. 

Tuesday, September 6, 2022

Update on the Insanity

It's been a pretty crazy 24-hour period on the meteorological "front."  Yesterday's high at KSLC was an incredible 104˚F.  Not only is this an all-time record for September, but it is the highest temperature ever reported at KSLC after August 5th.  Some colleagues of mine pointed out that this was 4˚F warmer than reported at surrounding sites.  I have to concur that the airport highs seem jacked, whether it be instrument or siting characteristics.  Nevertheless, 100-102 would still tie or beat the all-time for September, so it remains blisteringly hot for this time of year. 

I took the picture below at about 7:20 this morning while mountain biking in the Avenues foothills.  Notice anything unusual?


 Ha ha.  You can't see anything unusual, but the temperatures sure were.  I woke up at 6 am and it was 80˚F at my house.  80!  Overnight downslope winds in the University of Utah area kept overnight temperatures quite elevated. Surface observations at around 1200 UTC/0600 MDT showed NE flow around campus with temperatures 84-87˚F.  Incredible!  


What an insult to injury this September has been.  

Observations from the William Browning Building on campus are quite interesting.  They show overnight temperatures hovering near or just above 85˚F from about 2100 MDT yesterday to 0630 MDT this morning.  During this period, the flow was easterly with gusts reaching as high as 28 mph.  At a bit after 0630 MDT, however, the wind shifted and began to veer from southerly to northerly.  As soon as the wind shifted from easterly, the temperature dropped more than 10˚F as the valley cold pool replaced the warm easterly flow.  


Given the many complaints about KSLC, let's take a look at the first five days at Bountiful Bench where there is a complete record back to 1975.  

Sep 1-5 Average Max Temperature: 93.8˚F (prior record 90.2˚F, Sep 1-5 1975)
Sep 1-5 Average Min Temperature: 71.6˚F (prior record 68.0˚F, Sep 1-5 1978)

The duration of this heat wave will cause greater separation as it continues.  We will probably end up beating the 1-7 Sep records by about 4˚F.  

Monday, September 5, 2022

And So It Continues

Heat, heat, and more heat. What more can I say.  Salt Lake City easily tops records for the warmest four day stretch in the last week of August and first week of September with an average temperature of 85.9˚F.  Prior to 2022, the old record was 84.1˚F, set from 1-4 Sep 2019.  Prior to 2000, the record was 83.0˚F (26–29 Aug 1997).  

If you don't like the airport obs, 1-4 September 2022 was also the warmest four-day stretch on record in the last week of August and first week of September at Bountiful Bench (complete records since 1975) with an average temperature of 82.3˚F.  The prior record was 81.9˚F from 25-28 August 1997.  

Forecasts continue to advertise near or above daily-record warmth through Wednesday.  I suspect we will obliterate the average temperature for Sep 1-7 at the airport and many other stations in northern Utah.  There may be a slight retreat in temperatures after Wednesday, but they will still remain well above recent climatological "norms", whatever that means.  

The NWS forecast for the airport, downloaded this morning at 9:38 AM, is below.  Even adjusting for the tendency of this station to run a little hotter, it is crazy warm.   

Make it stop, please...

Friday, September 2, 2022

Crazy Heat for September

We are mired under a persistent upper-level ridge that is bringing record setting heat to a big portion of the west.  Yesterday's high of 102˚F at KSLC is the highest ever recorded in September.  Records are falling elsewhere as well.  

High 90s and low 100s look to predominate through at least next Wednesday.  The overnight forecast for early next week from the GFS in particular caught my attention.  There's still a monster ridge over the west and 700-mb temperatures at 0000 UTC 7 September (6 PM MDT Tuesday) near 20˚C over much of Utah.  


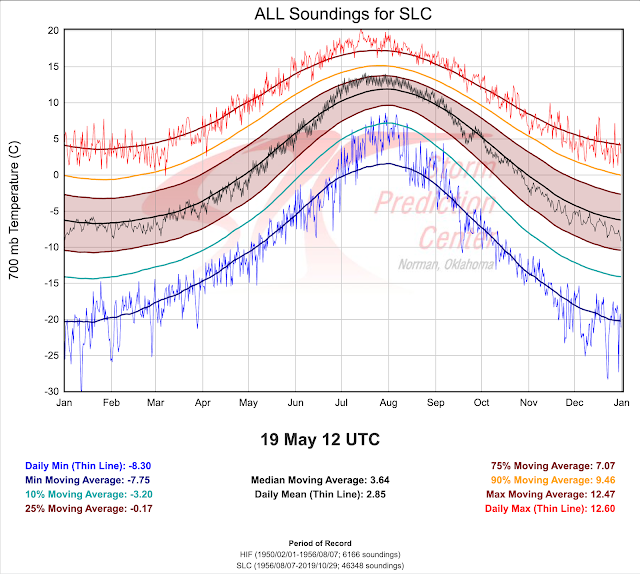
I often talk about the 20/20 rule for forecasting here.  Anything below -20˚C or above 20˚C at 700-mb (about 10,000 feet) is exceptional at KSLC.  The plot below shows statistics of 700-mb temperatures observed in upper air soundings collected at Hill Air Force Base or KSLC from 1950 to 2019.  The highest 700-mb temperature observed is 20.2˚C.  The highest for August or later is 19.4˚C.  For September or later, it's 17.2˚C. 


Yesterday afternoon's sounding observed a 700-mb temperature of 16.8˚C, so this was close to the highest on record in September.  However, I took a look at the raw numbers and the GFS is currently forecasting 19.3˚C at KSLC for late Tuesday afternoon around the time that the upper-air sounding is launched and the time of maximum temperature.  Such a temperature would be a whopping 2˚C above anything previously observed in September.  It's just one forecast model, but ensemble derived temperature forecasts for KSLC (not shown) further support the view that we are locked in for an unprecedented run of September warmth, adding insult to injury after a long, hot summer.  

Thursday, September 1, 2022

Summer Records at KSLC

Questions about the representativeness of the KSLC observing site notwithstanding, below are the new records for Salt Lake City based on official records from the National Weather Service.  Figures are from https://xmacis.rcc-acis.org/.

1. Highest average maximum temperature, 94.1˚F. 

2. Highest average minimum temperature, 68.8˚F.

3. Highest average temperature, 81.5˚F.


4. Days with a maximum temperature ≥ 100˚F, 27.


5. Days with a minimum temperature ≥ 70˚F, 53.


In an earlier post (A Look at Max Temps @KSLC) we took a look at temperatures at the observing site compared to site on the Bountiful Bench.  At that site, records go back to 1975 and this summer's mean maximum temperature was the 5th highest (86.5˚F, the record is 87.7˚F in 2007), the mean temperature was the third highest (76.0˚F, the record is 76.4˚F in 2021), and the mean minimum temperature was the second highest (65.5˚F, the record is 65.5˚F in 2021).  Let's also look at the top 5s for each of these variables at this site.  Records go back to 1975 and they are complete (i.e., no missing days).  

Minimum Temperature:
2021: 66.0
2022: 65.5
2003: 65.4
2007: 65.0
2012: 64.8

Mean Temperature:
2021: 76.4
2007: 76.3
2022: 76.0
1994: 75.8
2003: 75.7

Maximum Temperature:
2007: 87.7
2006: 87.7
1994: 87.5
2021: 86.8
2022: 86.5

The evidence is quite strong that we are in a different climate today along the Wasatch Front than the one that existed during the 20th century.  In recent years we are seeing higher temperatures, especially  minimum temperatures.  These data above shows this is happening on the valley floor and on the benches.  

More sleuthing is needed to evaluate the impact of station moves and land-surface conditions on trends at KSLC.  Ultimately, this won't change the story much.  We are living in a warming world and a warming urban area.  The summer climate of the 20th century is gone forever.  Fluctuations from summer to summer are occurring around a higher and climbing mean.