Showing posts with label Orographic Precipitation. Show all posts

Sunday, January 19, 2025

Snowbird Magic

In the previous post (Real Winter), I commented that the storm for Friday Night and Saturday was "a crap shoot situation given the limited moisture" and that "much will depend on instability, lake influences, and, for Little Cottonwood Canyon which might have the best chance of something, maybe some Alta magic."

In hindsight, I really didn't have any idea how complicated and productive the storm was going to be and that it was really "Snowbird Magic" that we were going to get.  

What Actually Happened

Automated data from Alta-Collins showed that at upper-elevations in Collins Gulch (9962 ft), about 11 inches fell with only 0.5" of water, yielding a 22:1 snow to liquid ratio or 4.5% water content. In other words, very low density snow, even if the use of gauge water equivalent measurements, which often don't catch all the snowfall, might result in a low estimate of water content.  However, remarkable contrasts of snowfall occurred in Little Cottonwood and Alta was not the big winner.  

As noted in the Utah Avalanche Center report "some areas of Upper Little Cottonwood received 20.5 inches of snow (0.97 inches of water)." That 20.5 inches appears to be from Snowbird, which reported a 48-hour total of 20 inches on their mountain report this morning. I wasn't skiing yesterday, but from what I've heard, snowfall appeared to increase with decreasing elevation at the Little Cottonwood resorts, with perhaps the base of Snowbird serving as the snow capital of Utah for a day.  

How Could This Happen?

I can only put forth some hypotheses that might be worthy of greater investigation.  These are based in part of my analysis of the event and other storms that have done some oddball things like produce more snow on the east bench than in upper Little Cottonwood Canyon. These are sometimes called "upside down storms" because snowfall decreases with elevation (see Classic "Upside Down" Storm), not to be confused with upside down snowfall in which higher density snow sits on top of low density snow. 

First, let's establish the time period that the snow fell.  To do this I'm going to use data from Alta-Collins since I don't have access to observations from the Snowbird Base.  Measurable water-equivalent precipitation was recorded at Alta-Collins in all but two hours from 0600 UTC 18 January (11 PM MST Friday) to 0100 UTC 19 January (6 PM Saturday). The break was from 1800 to 2000 UTC (11 AM to 1 PM Saturday).  Water-equivalent rates were unimpressive throughout this event and less than or equal to 0.07" for the entire period and automated measurements suggested that at no time did snowfall rates exceed 1" an hour.  This doesn't mean that there couldn't have been some short bursts (less than an hour) that were heavy, but they never produced more than an inch increase in interval-board snow at this location.


Snowbird, however, had nearly double the snowfall.  Peak hourly water equivalent and snowfall rates there were certainly higher. 

Large-Scale Environment

The large-scale environment in which that snow fell featured the passage of an upper-level trough in large-scale north-northwesterly flow.  This was a cold system and somewhat moisture starved compared to troughs that approach us from the west or northwest (even at Snowbird where snowfall was heaviest, the low-density nature of the snowfall in this event was certainly an inch or less).  Below is the GFS analysis for 1200 UTC 18 Jan (5 AM MST Saturday) showing the trough just upstream of northern Utah.  

The sounding from the Salt Lake City Airport at 1200 UTC 18 January (5 AM MST Saturday) is below.  This is upstream and not necessarily representative of what was going on in Little Cottonwood at that or other times, but there are some things that capture my attention. First, the atmosphere below 700-mb (roughly 10,000 ft) was consistent with the shallow convective clouds that I observed during the event.  It was well mixed at low levels with the dewpoint depression (the difference between the temperature and dewpoint decreasing with height to an apparent shallow cloud layer between 750 and 700 mb (for whatever reason, the NWS soundings rarely show the same dewpoint and temperature even in cloudy air). I've identified this layer with a purple box.  
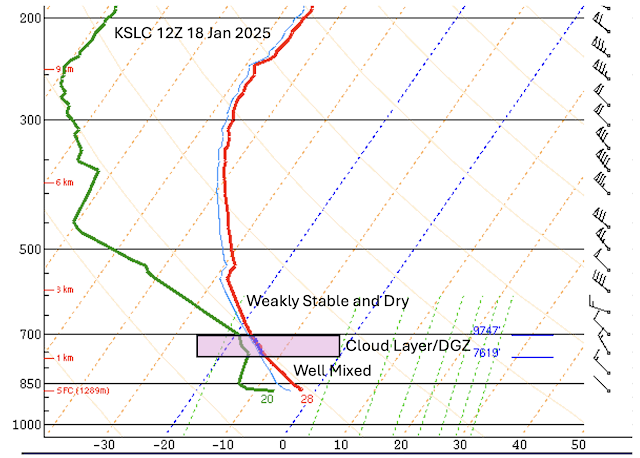
That layer also had temperatures between -12 and -18C, or what is called the dendritic growth zone or DGZ.  Those are the temperatures that given suitable relative humidities, favor the development of dendritic snow crystals (the six armed beauties that we have all come to know and love).  Given the low-density snow in this event, I'd expect a lot of snow growth in this layer.  

Above the apparent snow layer, the dewpoint and temperature diverge again with height.  In addition, that layer is weakly stable, which would make it difficult for convective clouds to penetrate to higher altitudes.  

So, this one sounding suggests this was a shallow system and that the layer for dendritic growth was confined to below 700 mb or 10,000 feet.  

Radar Analysis

Finally, we have the radar.  There are a lot of problems using radar to estimate precipitation in a situation like this.  First the beam is partially blocked by the topography, and the influence of that blockage varies depending on location.  Second, this is a very shallow storm, so the storm clouds may only partially fill the beam.  Finally, this was lower density snow, which is notoriously problematic for radar precipitation estimates.  With those caveats in mind, below is the estimated water equivalent precipitation for the 24-hour period ending at 0300 UTC 19 January (8 PM Saturday).  The highest amounts are on the Cottonwood ridge (green squares indicate 0.5 to 0.75" of water) from about Mt. Superior westward. Amounts decrease as one moves eastward and northeastward from Mt. Superior into upper Big Cottonwood Canyon. 


That estimate is roughly consistent with what I observed on radar during the storm which was that echoes tended to be stronger and more frequent not in the highest reaches of Little Cottonwood, but west of Alta. Because of terrain blockage, however, the radar cannot tell us much about the local snowfall variations within the canyon itself, especially near the canyon floor and the base of Snowbird.   

An Initial Hypothesis

My best guess of what was happening in this event is as follows.  It was a shallow storm in flow that was generally from the northwest (on Hidden Peak and Mt. Baldy the flow was WNW or NW for the entire storm period).  The latter is consistent with enhancement in Little Cottonwood, but the shallow nature of the cloud layer and the weakly stable and dry nature of the airmass above crest level may have limited storm penetration into the interior of the central Wasatch and certainly into the lee.  This, or maybe just dumb luck, led to greater precipitation frequency and intensity west of Alta. 

In addition, this was a cold storm.  Temperatures on Hidden Peak and Mt. Baldy were at or below -18C for most of the storm period.  As a result, the dendritic growth zone was below crest level, potentially resulting in greater crystal growth within the canyon volume (i.e., below the ridge tops), leading to greater accumulations not at the highest elevations, but instead at mid elevations.  

There could be other factors at play.  Feel free to share your observations of snowfall or your ideas for mechanisms in the comments.  

Summary

What a storm!  Snowbird Magic 1, Alta Magic 0.

Tuesday, November 26, 2024

Can You Help Explain the Overnight Snows

Sometimes those with investment portfolios and trophy homes get the last laugh and that was the case last night with Deer Valley the big winner in the central Wasatch.  Below is a look at the Ontario Snow Stake Web Cam at 8:05 AM showing a solid 8".

Source: https://www.deervalley.com/explore-the-mountain/webcams

Meanwhile, on the other side of the Wasatch, at a ski area also frequented by people with investment portfolios and trophy homes but better known for deep powder, pickings were much slimmer.  

Source: alta.com

This is a pattern that does sometimes bless the Deer Valley side, although I confess I don't exactly know why, in part because of poor radar coverage, poor radar estimates, and limited observational data.  

The issues with radar coverage are apparent in the plot below, which shows the accumulated precipitation estimated from the National Weather Service Radar (KMTX) for the 6-hour period ending at 1400 UTC (7 AM MST).  The radar thinks the heaviest precipitation is in upper Big Cottonwood, in Brighton Basin, rather than to the east in the Deer Valley Ontario area. 

Source: https://mrms.nssl.noaa.gov/

In part, this reflects differential orographic blocking of the radar, which results in weaker returns (all else being equal) in the Deer Valley area.  It could also reflect overshooting by the beam if the growth of snow crystals in this situation is shallow.  Finally, the correlation between radar reflectivity and snowfall rate (including water equivalent rate) is much lower than it is for rain, so there are times when radar estimates are simply out to lunch.  In any event, the National Weather Service radar is not all that helpful for understanding what is happening in these events.  

There is also a complete lack of upper-air observations near Deer Valley, so we have to make due with the sounding from the Salt Lake City International Airport.  This morning's sounding shows southerly winds at low levels and westerly flow at 700 mb, roughly 10,000 feet. At issue is whether or not the flow in the Heber Valley in such a pattern is lifted and produces local, shallow snowfall enhancement on the Deer Valley ridgeline.  Some have speculated this is the case, but the hypothesis has not been carefully evaluated. 

Source: SPC

Perhaps a conflicting piece of evidence in this case is that the flow direction on Mount Baldy was not southerly overnight but southwesterly.  

If it was southerly or southeasterly, it would fit this hypothesis a bit better.  Of course, there's always the possibility that wind direction is affected by local conditions and the overall flow in that area is actually ascending out of the Heber Valley.  

I have another hypothesis, although it might not be as compelling as the flow direction one.  As shown in the sounding above, the crest level flow in this case was westerly and we had near saturated conditions through a deep layer, with strong flow in the upper troposphere.  On the other hand, the low level atmosphere in the Salt Lake Valley was dry with a relatively high cloud base.  A look at radar echoes for this period showed that they were not evident right over the immediate western face of the Wasatch, but somewhat downstream. 


My hypothesis is that in this event, we are seeing a situation where there is weak orograhic lift over the western Wasatch, but it is is deep, resulting in ice crystal generation aloft. Those ice crystals are carried downstream and fall out preferentially downstream of the Wasatch Crest over Deer Valley.  

There are examples of this happening over other ranges.  The best example I can think of is a case examined by Geerts et al. (2015) in the Range of Wyoming.  They flew through the storm in an aircraft with upward and downward pointing cloud radars (the dashed line below is the aircraft flight level).  These radars don't scan, but instead collect a continuous curtain of radar data above and below the flight track, allowing the detailed vertical structure o fthe storm to be observed.  The top panels are two different flight flight tracks during the storm.  In both cases, there are no low echoes upstream of the mountain and on the windward (left) side of the crest, reflectivities are highest aloft.  They calculated the streamlines of ice crystals and showed that those generated in this windward area aloft were carried downstream and fell out on the lee side of the mountain. 

Source: Geerts et al. (2015)

That paper is a favorit of mine because it shows how you sometimes need to think beyond where the mountains are forcing rising motion. You also need to think about transport and fallout.  This is particularly important when there is crystal generation aloft, possibly well above the crest.  

Anyway, that's my story and I'm sticking to it.  Perhaps you have other ideas and can help explain the overnight distribution of snowfall.

Sunday, February 11, 2024

Snowfall Extremes at Alta, Part II

This is the second part of a blogstorm examining a new paper by Michael Wasserstein and I examining snowfall extremes at Alta.  The paper was just published in what is known as early online release and is available at https://journals.ametsoc.org/view/journals/mwre/aop/MWR-D-23-0206.1/MWR-D-23-0206.1.xml, but may be paywalled if you don't work at an institution with a license for American Meteorological Society journals or have an American Meteorological Society membership (apologies).  However, we are summarizing the key findings in this blogstorm. 

In Part I, we examined the relationships between flow direction and heavy snowfall at Alta, highlighting that heavy snowfall can occur from a wide range of flow directions, but most commonly for SSW or WNW flow for Liquid Precipitation Equivalent (LPE) and the latter for snowfall amount.  The bias toward WNW flow for snowfall amount reflects that such flows are typically colder and feature higher snow-to-liquid ratios, which means you get more snow out of a unit of water.  We also identified seven key synoptic patterns for generating heavy snowfall.  

Here we examine the relationship between Integrated Vapor Transport (IVT, a common metric used to identify atmospheric rivers) and heavy snowfall at Alta.  Unlike what one might find in the Sierra Nevada or Cascades, this relationship is actually quite complex or, as I like to call it, fickle.  

To illustrate this, we looked at the time-integrated IVT (or TIVT) during extreme precipitation periods.  IVT is an instantaneous measure of the horizontal transport of water vapor over a given location.  TIVT is the total horizontal transport of water vapor over a given period (in this case 12 hours).  

The figures below present the TIVT for the snow amount and LPE extremes, with direction consistent with the 700-mb (crest level) wind and vapor transport direction.  An IVT of 250 kg/m/s, generally used as the low-end threshold for an atmospheric river, yields a TIVT of 1.1x10e7 kg/m (Editors note: This value was updated from the original post to correct an incorrect value), which is near the outer circle of these figures. These figures show that true AR conditions for a 12-hour period at Alta are extremely rare.  In addition, many snow amount and LPE extremes occur for TIVTs well below those associated with ARs.   

Source: Wasserstein and Steenburgh (2024)

So we decided to take this a step further and look at how much of the vapor that is transported over Alta is converted into precipitation during the snowfall amount and LPE extremes.  We call this the Local Precipitation Efficiency.  Consistent with the analysis above, this efficiency is especially high during WNW or NW flow. 

Source: Wasserstein and Steenburgh (2024)

So those northwesterly flow storms get a lot out of a little.  

Finally, we decided to look at what happens when the IVT is high at Alta.  Given that true AR conditions with IVT ≥ 250 kg/m/s are extremely rare at Alta, we lowered the IVT threshold to 200 kg/m/s.  During the 23 cool seasons we examined, there were 112 periods (about 5 per year) in which the mid-point IVT was ≥ 200 kg/m/s.  Of these, only 19 produced an LPE extreme at Alta and 37 produced no precipitation at all.  These are the the highest local IVT events a year although some can go big, some are total busts.  

All of this indicates that one needs to avoid what I'll call AR-myopia at Alta.  Snowfall extremes, especially in NW flow, can occur with relatively low IVT.  Locally high IVT (≥ 200 kg/m/s) can sometimes produce a big snowfall amount or LPE event, but there are times when it produces little to no precipitation.  The correlation between IVT and precipitation at Alta simply is not high enough to justify using IVT in isolation for precipitation prediction.  

To that point, we also breakdown the differences between high IVT events that produce an LPE extreme and those that don't produce LPE.  The former typically are colder, feature higher relative humidities, and stronger large-scale ascent.  The latter is sometimes referred to by meteorologists as "forcing" and would be produced by, for example, and upper-level trough and/or surface front.  Essentially, you need an environment that favors precipitation generation.  During high IVT, forced ascent over the central Wasatch, by itself, is not sufficient to do the job if the airmass is not close to saturation and there is a lack of large scale forcing for precipitation.   

Thanks for reading!

Friday, February 9, 2024

Snowfall Extremes at Alta, Part I

Michael Wasserstein and I have a new paper out examining our favorite research topic: Snowfall extremes at Alta. The paper was just published in what is known as early online release and is available at https://journals.ametsoc.org/view/journals/mwre/aop/MWR-D-23-0206.1/MWR-D-23-0206.1.xml. 


It may be paywalled if you don't work at an institution with a license for American Meteorological Society journals or have an American Meteorological Society membership (apologies).  However, we'll hit some of the highlights in this special two part Wasatch Weather Weenies blogstorm, beginning here with Part I.  

The inspiration for this work was a paper by Larry Dunn, a long-time meteorologist and avid skier, that was published as a NOAA Technical Memorandum in 1983. 


Many of the relationships between flow (especially wind direction) and local snowfall enhancement at various locations in the Wasatch Range that are used today are based on this paper.  

Michael and I thought we would do an update, focused on Alta, and using modern atmospheric analyses, diagnostics, and observations. Using data collected and generously provided by the Alta Ski Patrol, we focused on large 12-hour snowfall events, defined in two ways.  The first was based on snowfall amount.  The second based on the liquid precipitation equivalent (LPE) of snowfall.  Large here means in the top 5% (known as the 95th percentile) with at least 2.54 cm (1 inch) of snow for snowfall or 2.54 mm (0.1 inch) of water for LPE. This 95th percentile works out to be 30.5 cm (12 inches) for snowfall amount and 27.9 mm (1.1 inches) of water for LPE.  

Source: Wasserstein and Steenburgh (2024)

Below is a classic figure from Dunn (1983) illustrating the 700-mb (about 10,000 ft) wind speed and direction during heavy precipitation events at Alta. He used 1" of water equivalent in 24 hours for the threshold for heavy events and presented his results in a hand-drawn diagram that meteorologists sometimes refer to as a wind rose.  This figure identified the high frequency of heavy events in northwesterly flow.  Note also that events peak at a speed of around 10 m/s (about 20 knots)

Source: Dunn (1983)

Below is our updated take using our 1.1" in 12-h threshold and enabling comparisons with climatology (all periods during the cool season), all snow events, all LPE events, and all of the extremes.  In figure d, you can see the high frequency of 700-mb flow from the WNW and NW during snow amount extremes peaking at near 10 m/s. If you look carefully though, you'll see a secondary maximum for flow from the SSW.  For LPE, there is are two clear maxima centered on the SSW and WNW.  You will also notice that snow and LPE extremes have occurred across a wide range of flow directions from SE to WNW (or even N for the former).  

Source: Wasserstein and Steenburgh (2024)

A few key points to take from this figure.  First, snowfall extremes can happen for a wide range of flow directions and wind speeds.  This is why I like to emphasize the great diversity of storms that affect Alta and not discount storms just because they don't have NW flow.  If they dynamics are right, Alta can get it.  Nevertheless, a high frequency of large LPE events occurs for flow form the SW and WNW.  This is known as a bimodal distribution.  For snow though, the WNW maximum is much stronger.  This reflects the influence of snow-to-liquid ratio.  The WNW flow storms tend to be colder, and produce more snow per unit of LPE, so that flow direction lights up more frequently for snowfall amount extremes.  

We also identified seven major synoptic storm types contributing to snowfall extremes at Alta.  Four were associated with enhanced integrated vapor transport (IVT) penetrating inland from the Pacific coast from the south (SIVT), southwest (SWIVT), west (WIVT), or northwest (NWIVT).  

Source: Wasserstein and Steenburgh (2024)

IVT is often used to identify atmospheric rivers, but this turns out to be a complex matter that we will talk about in greater depth in Part II.  

The other three patterns were northwesterly post frontal flow events (of course), frontal (associated with a stationary or cold front), and cold-core lows with southwesterly flow.  

Source: Wasserstein and Steenburgh (2024)

We did not distinguish between northwesterly post frontal flow events with and without lake effect as that would have been another major effort.  We'll let you sort through the radar data to do that!

That's enough for now.  We'll dig into this further in a forthcoming Part II post.  

Tuesday, July 11, 2023

Northeast Deluge

Chances are you've seen some of the footage of the remarkable flooding in the northeast the past couple of days.  

We will focus here on the Adirondack Mountains of New York and the Green Mountains of Vermont.  The National Weather Service Burlington Forecast Office produced a map earlier today of the storm total precipitation for their forecast area, which extends across northern New York.  The event featured impressive enhancement over the Green Mountains and portions of the Adirondacks.  In the case of the Greens, a broad area of more than 5" fell including more than 9" in Plymouth just to the south of Killington along Route 100.  In the Adirondacks, more than 5" fell in Newcomb.  

Flooding, mudslides, and washed out roads have occurred in many areas.  Below is drone footage from yesterday in Montpelier, which was posted by The Weather Channel.

Extensive damage is also being reported in the Long Lake, Blue Mountain Lake, and Newcomb area of the Adirondacks.  I've traveled through this area hundreds of times (that's not an exaggeration).  So hard to see.  

Tuesday, February 28, 2023

Oh What a Night!

You can't stop Mother Nature this season.  More insane numbers from the Wasatch.  As reported by the Utah Avalanche Center this morning, storm totals for the PC Ridgline are now .95–1.05" water and 15–22" of snow and Upper Cottonwoods 1–2.5" of water and 16–35" of snow.  The Ogden and Provo area Mountains have also been blessed with big dumps. 

Snowfall late yesterday was intense at Alta-Collins. Hourly snow interval observations show an increase in snow depth from 3 to 10 inches in two hours from 5 to 7 PM.  Normally the board is wiped between 4 and 5 PM, but I can't tell if that was done as the interval remained at 3 inches.  Given the intense snowfall rates, it is possible it was wiped and it basically was snowing 3" an hour starting at about 4 PM.   

I've heard that the Cottonwoods were a mess during this period and that the overnight road closure was moved up to 8 PM.  If so, I suspect both were closely related to the heavy snowfall. 

Radar observations during the period of heavy snowfall showed strong orographic enhancement of precipitation in the southern central Wasatch and Mt. Timpanogos area, with spillover to the Deer Valley Area.  There was also enhancement over the southern Stansbury and Oquirrh Ranges.  

The flow during this period was southerly at valley level and southwesterly at crest level and, perhaps most importantly, the dendritic growth zone, a layer in which temperatures are between -12 and -18˚C and conducive for the formation of dendritic, low density snow, sat right at and above crest level (10824–12762 ft as identified by blue lines in the plot below).   


All of these things are easy to spot in hindsight, but what separates a garden variety snowfall from an intense one is hard to identify reliably in advance.  Just because the ingredients are there, doesn't mean Mother Nature will bake the cake. 

Embedded in this storm was something that I don't understand.  For an extended period of time, a southwest to northeast oriented band developed over the Lone Peak Massif (just north of the cursor in the loop below) and extended downstream over Little Cottonwood and upper Big Cottonwood Canyons.  At ties, you can see siilar bands forming downstream of Mt. Timpanogos and even the southern Oquirrh Mountains.  


I have seen such features at times before and have event posted on them previously (see Something I Don't Understand).  They have been identified in the Alps, but I am not sure if the ones we see here are a close cousin or a distant relative.  Regardless, I wish we had a very detailed snowfall measurement network to identify the impact of this band on snowfall distribution in the Wasatch.  

Something else is evident in the loop above and that is the cold front that came through last night with a bang.  First the wind woke me up and then I saw a couple of flashes of lightning (but I heard no thunder).  I've heard reports of thunder and lightning around the area, and lightningmaps.org observed many strikes along the northern Wasatch Front, two in Tooele, one in South Jordan, and four in Utah County.

Source: lightningmaps.org

Paraphrasing Frankie Valli:

Oh, what a night
Late February back in twenty three
What a very special time for me
As I remember what a night

Saturday, January 22, 2022

Northern Stau

If you follow ski racing, you know that this Friday and Saturday should each have featured a men's downhill and Sunday a slalom on the famed Hahnenkamm in Kitzbuhel, Austria.  Instead, the meteorologists won the day and the Saturday downhill and Sunday slalom were switched due to anticipated heavy snowfall on Friday night and Saturday.  

Indeed the Saturday snow did materialize and Dave Ryder won Great Britain's first world cup race as he unleashed a great second run and the top skiers from the first run flailed in the difficult conditions.  

Ryder learned to ski on plastic slopes in England and has been knocking at the door for a win for a long time.  Great to see him get his first win at the age of 35, a day after Johan Clarey of France came in 2nd in the downhill at 41.  I believe Clarey is the oldest skier to podium in world-cup history.  

Getting back to meteorology, the snow was produced by a common eastern Alps storm type know as Nord Stau or northern blocking.  These storms occur when there is a high pressure west of the Alps and low pressure to the east, resulting in moist, northerly flow directed towards the Alps.  Often, the flow is stable and the low-level airmass is unable to surmount the massive Alpine barrier.  As a result, the low-level flow is blocked and becomes westerly near the Alps.  This can yield heavy snowfall upstream of the Alpine foothills and terrain near the northern Alpine Rim.  Often there is a dramatic weather near the Alpine Divide, with dry conditions or even clear skies to the south.

This is precisely what happened today.  I've provided a sketch below on the MODIS imagery from midday.  Northerly flow over Germany to the north of the Alps and low-level westerly flow near the Alps, with a transition from cloudy and snowy near and north of the Alpine Divide to clear skies to the south.  

Source: NASA

Evidence for this flow pattern is apparent in the 1200 UTC sounding from Munich, which is about 50 km north of the Alpine foothills.  The low level flow is westerly, but veers to northerly at about 900 mb, or 1000 meters above sea level.  

Source: University of Wyoming

Nord Stau can produce more in the lower terrain near the northern Alpine Rim than on the much higher Alpine Divide to the south.  Below is the 6-hour difference in snow depth analysis for the region for the period ending at 5 AM local time this morning.  Snowfall is clearly greatest near and along the Austrian-German border north of Kitzbuehel where peaks are generally around 1500-2500 meters high.  Snowfall declines to the south along the Alpine Divide where there are many peaks over 3000 meters.  Practically no snow fell south of the Alpine Divide.  

Source: https://avalanche.report/

If you woke up this morning in Innsbruck, you could have elected to ski powder near the northern Alpine Rim or traveled through the Brenner Pass for sunny skies.  Your choice. 

Thursday, April 15, 2021

Storm Update

Pretty amazing storm yesterday as the "eastern band" discussed in yesterday's post intensified and delivered heavy snowfall to the central Wasatch Range yesterday morning.  Snowfall rates peaked from 11-12 MDT with several automated observing sites from Little Cottonwood Canyon to Park City Mountain Resort recording more than 4" of snow in that hour.  Alta-Collins ticked off 5.  


Radar imagery at just after 11 am showed strong returns over the Cottonwoods and Park City Ridgeline.  Even east of the crest, the reflectivities were quite high.  Because of partial blockage of the outgoing radar energy by the Wasatch Range, there's less energy available to reflect back to the radar, so those are pretty healthy returns for east of the crest.  


Consistent with the radar, we saw something that we haven't seen much of this winter: heavy snowfall in Park City and Summit Park.  National Weather Service spotters reported 13" at 6824 feet in Park City through 2 PM yesterday and 17.5" in Summit Park through 6 PM.  

Several factors probably contributed to these big amounts east of the crest.  As discussed in yesterdays post, the upper-level flow was from the south-southwesterly, so shadowing effects were limited.  Expanding on that point, the low-level, near surface flow at 11 am was either light or easterly at many locations in the central Wasatch.  For example, Parley's summit reported a 15 knot east wind, Empire Peak at Deer Valley a 10 knot east-southeast wind, and sights in Brighton and Alta both reported winds with an easterly component.  


So the situation was one with heavy snowfall being generated in a band in the south-southwest flow aloft, but the low-level flow producing upslope on the eastern slopes of the Wasatch Range.  Snowfall was still very heavy west of the crest due to the influence of the band, but there was no shadowing effect on the east side and there may have even been an upslope affect to aid precipitation generation.  

I also received an interesting photo from one of our readers, Mike Freeman.  It was taken looking toward Parley's Canyon and Grandeur Peak at 3:32 PM MDT.  Note how it appears that there's no wnow at mid elevations in the circled area, but snow at low elevations.  


Is this simply an optical illusion?  I suspect if you were walking up ridge on the right in the oval you'd go from snow to no snow. 

I have a few hypotheses for why this happened, but encourage you to share your ideas for how this occurred in the comments.

Friday, March 12, 2021

The Front Range Storm

If you are looking for oddities in the snow climate of the western United States, the area near and immediately east of the Continental Divide is a good place to start.  

First, let's talk about the snowiest month of the year, as illustrated in the plot below from Brian Brettschneider.  Most of the western United States and Canada west of the Continental Divide sees their snowiest months in December, January, or February.  However, near and east of the Continental Divide, the snowiest months are late in the cool season and in many areas in February, March, or even April.  


Focusing on the Front Range region of Colorado, based on average snowfall, the snowiest month in Boulder is March (16.1").  The least snowy month from November to April is actually January (9.7"). 

One of the reasons for this is that the late winter and spring are the peak period for the development of lee cyclones over southeast Colorado.  Such storms can tap into Gulf Moisture which is transported northward and eastward toward the Front Range.  

The models have been forecasting such a cyclone to develop tonight and tomorrow, resulting in a prolonged period of precipitation in the Front Range area over the weekend.  Below is the GFS forecast for 1200 UTC 14 March (0600 MDT Sunday) showing the cyclone centered over southeast Colorado with heavy precipitation encircling the system to the east and north.  Precipitation is heaviest north of the low center where strong frontal forcing and upslope flow over the high plains impinges on the Front Range.  


In these situation, there is often a band of colder, terrain-channeled flow near but upstream of the windward slope of the Front Range. Below is an example from a paper by Larry Dunn showing easterly flow over the plains to the east but, northernly flow near the Front Range (Boulder indicated by BOU). 

Source: Dunn (1987)

The boundary between those two flows, often referred to as a blocking front since the terrain channeled flow is a result of topographic blocking, is often the locus for enhanced vertical motion, resulting in heavier precipitation near and downstream (in this case west) of the blocking front.  

Source: Steenburgh (2014)

For the last couple of days, the GFS and members of the Global Ensemble Forecast System (GEFS), which shares components with the GFS, have been spitting out some insane snowfall numbers for the Front Range of northern Colorado.  Below is the downscaled NAEFS forecast plume from 0000 UTC 10 March.  The NAEFS is comprised of members from the GEFS and the Canadian (CMCE) ensemble.  The mean for Boulder for this weekends storm was around 2" of water and 20" of snow, but most of the GEFS members were above this, resulting in a mean closer to 25" of snow, whereas most of the CMCE members were below this, resulting in a mean closer to 15" of snow.  


The GFS is not included above, but it has been on the high side of the ensemble, putting out some insanely big numbers.  In contrast, the European has been more along the lines of the Canadian.  

A glimpse into the thinking of meteorologists dealing with this spread in forecasts is provided by the snippet below, taken from the National Weather Service Boulder Forecast Office Area Forecast Discussion issued 819 PM 11 March:

Source: NWS Boulder

The latest downscaled SREF has most members leaning toward a modest storm for Boulder, with most members in the 5-12" range, but a couple much higher than that.  


This is a storm that illustrates both the challenges of weather prediction, but also the challenges of forecast communication given the range of possible outcomes from modest to historic.  

Wednesday, February 17, 2021

Why There's a Huge Snowfall Contrast from Alta to Park City

The snowfall contrast between Little Cottonwood Canyon and Park City Mountain Resort over the past 24 hours is quite dramatic.  

In upper Little Cottonwood Canyon, Alta reported 30 inches of snow. 

In upper Big Cottonwood Canyon, Brighton reported 22 inches of snow.

On the Park City Ridgeline, Park City Mountain Resort reported only 12 inches.  

The distance between Alta the top of the Jupiter chairlift at Park City Mountain Resort is less than 5 miles!  That's a huge contrast in snowfall.  How can this happen?

One of my late-career dreams is to have the University of Wyoming King Air research aircraft flying through a storm like this one with it's world-class cloud radar.  This instrument takes cat scans in storms.  One thing I would like to have it do is fly directly down the northwesterly flow and examine the storm structure from northwest to southeast.  Here's why.

We often generalize the western side of the Wasatch Range as the "windward" and wet side and the eastern side as the "leeward" and dry side.  That, however, is an oversimplification.  In reality, the terrain felt by the flow varies depending on wind direction and because the Wasatch range isn't linear, but contains complex ridges, canyons, and inflections.

For example, the late-afternoon sounding from yesterday showed that the 700-mb (crest level or 10,000 foot) flow was from 315˚.  If you are in Little Cottonwood Canyon or the high terrain surrounding it, flow from this direction (i.e., along the thick black line below with the topography along that line in profile at the bottom) moves across the relatively low Salt Lake Valley and then is forced rise rapidly over the Cottonwood Ridge and Alpine Ridge.  These two ridges are over 11,000 feet high and represent the highest terrain in the central Wasatch.  During unstable flow, this results in persistent initiation of clouds and precipitation just upstream and over Little Cottonwood Canyon.  

Source: caltopo.com

As you move northeastward to the Park City Ridgeline, the situation changes.  Not only is the Park City Ridgeline lower (highest peaks 10,000 feet, it is also oriented parallel to the flow.  In addition, because the Wasatch near North Salt Lake City and Bountiful just westward, the flow encounters mountains well upstream of the Park City Ridgeline.  Instead of rapid ascent over about 6,000 vertical feet, the flow ascends more gradually, encountering small ridges along the way.  

This is simply not a great situation for heavy snowfall on the Park City Ridgeline as the terrain-forced ascent is less intense.  Indeed, snowfall reports from Bountiful are in the 10-14 inch range, comparable to that reported by Park City Mountain Resort.  

There are probably some other factors involved as well, but I think these differences in the shape and scale of the terrain felt by the flow from the northwest are a contributor.  Perhaps more on other factors in future posts, but I'm going to have to get some real work done soon.   

Wednesday, February 3, 2021

Something I Don't Understand

There are some recurrent things that happen during storms over northern Utah that I don't understand.  Here's one of them.

Early this morning in the pre-frontal southwesterly flow, precipitation developed downstream of Mount Timpanogos and the surrounding Wasatch Range in the area circled in red below.  


The precipitation pattern was somewhat disorganized, but exhibited some banded structures at times.  Echoes clearly were forming near and downstream of the Wasatch Crest and extended well downstream into the western Uinta Mountains.  

I have seen a few examples of leeward precipitation over the years, all typically associated with strong cross-barrier flow.  I have some hypotheses for how this happens, but have never been able to explore them.  In this case, I think it is especially interesting that the echoes appear downstream of the range, suggesting that this is not a case of precipitation forming on the windward side and being carried into the lee by the prevailing flow.  Instead, it appears that something is happening dynamically to spur ascent and precipitation growth downstream of the Wasatch Crest.

Somewhat similar features have been documented in the pre-frontal environment on the northern side of the Alps.  Below is a radar image presented by Siedersleben and Gohm (2016) showing a case with southerly pre-frontal flow across the Alps with banding forming on the leeward (north) side and extending downstream over southern Germany.  

Source: Siedersleben and Gohm (2016)

The generation of those bands is related to how the flow interacts with small-scale topographic features in the Alpine topography, combined with atmospheric instabilities (for brevity, I'm not going to get into those instabilities).  A smooth mountain range doesn't produce these features, and even with a rough one like the Alps, these features don't form in every storm.  

The precipitation pattern observed downstream of the Wasatch Range last night featured banding on a somewhat small scale than that pictured above.  Further analysis is needed to evaluate this hypothesis, or to refine and come up with a better one.  

Thursday, April 2, 2020

The Seeder-Feeder Effect

There was a great visual example of the seeder-feeder effect this morning over the central Wasatch.  The seeder-feeder effect involves the fallout of precipitation from seeder cloud aloft into a lower-level cloud generated by flow over a mountain barrier.  This can result in the growth of ice crystals that originated in the seeder cloud as they fall through the feeder cloud, leading to precipitation enhancement over the mountains, as illustrated schematically below.

Source: Secrets of the Greatest Snow on Earth
Below is a photo I took about 7:10 AM MDT this morning.  Thin, mid level "seeder" clouds were producing falling ice crystals aloft.  These crystals then fell into a feeder cloud associated with orographic lift over the central Wasatch. 


At this time, precipitation rates were very like and I suspect if you were on, for example, Lone Peak you probably would have noticed just a few flakes.  Nevertheless, this is a nice illustration of what happens during seeder-feeder, which during precipitation events often can't be "seen" without the use of a radar.

Monday, February 3, 2020

Classic "Upside Down" Storm

This is not the first upside down storm we've seen in these parts and it won't be the last.  In the upside down storm, snowfall totals on the benches (and sometimes valley) exceed those in the mountains. 

Here are some observations from the eastern Salt Lake Valley from this morning:

Sandy: 17" (through 10 AM)
Cottonwood Heights: 16.5" (8 AM)
Midvale: 16" (9 AM)
Holladay: 15" (8 AM)

Meanwhile, in the mountains Summit Park has 3.5" as of 7 AM, Alta-Collins 6" (10 AM), and Park City Mountain Resort 3" (5 AM). 

As noted in an earlier post, the possibility of an upside down storm was anticipated by NWS forecasters. Here's there expected snowfall graphic issues yesterday afternoon at 3:58 PM.  12-18" on the Salt Lake City east bench, 4-6" at Alta, and 3-4" in Park City. 


Kudos to them.  I was expecting a small contrast between the bench and the mountains, but not something that upside down. 

On the other hand, if we look at longer lead-time forecasts, such as the one below from 03:01 AM yesterday, they don't go for as strong of an upside down pattern, with roughly equal amounts at Sandy and Alta.  The reality is that the processes that drive upside down events are quite sensitive to small changes in the large-scale flow and thus are hard to forecast with confidence at long lead time.  This makes it difficult to go all in at longer lead times.  Basically, their forecast evolved as more information came in and the lead time shortened. 


So, what made for this upside down storm?  Probably several factors.  As shown in the sounding below, the atmosphere was saturated or nearly saturated right down to the valley floor.  This is a remarkably moist sounding for Salt Lake City in northwesterly flow.  Second, the dendritic growth zone, which features temperatures between -18 and -12˚C, was located at and below crest level.  This favored the growth of low-density dendritic snow crystals below crest level and led to very large snow-to-liquid ratios — meaning a lot of snow from a small amount of water. 


Potentially another player is the stable layer evident at about 680 mb, which is near or just above crest level.  Such a layer prevents the flow over the valley from simply rising over the mountains, so the orographic lift is weaker. 

These sorts of upside down storms are common on the northern side of the Alps where they are known as "stau storms."  Google translator will tell you that stau is German for traffic jam, but meteorologically, stau storms are storms that feature stagnation and blocking on the windward side of the Alps.  This often leads to heavier precipitation in the Alps north of the Inn Valley and the foothills and foreland further upstream.  For more see our post from last year, Stau Storm.

Salt Lake Getting a Dose of Real Winter

We have had a cold, windy storm like this in the Salt Lake Valley in a long time.  As anticipated by the National Weather Service, it blew in last night and is mucking up the morning commute good.  The screenshot below was taken at 7:44 AM and shows heavy to medium traffic with multiple incidents along much of the freeway system as well as at the lower Cottonwood Canyons.

Source: UDOT
Radar imagery shows widespread snow that is heaviest in six areas.  I've circled four of them, which are located on the western sides of the Stansbury Mountains, Standbury Island, Oquirrh Mountains, and central Wasatch.  The fifth is the northern Wasatch Front and the sixth is an apparent lake-effect band aligned near the major axis of the Great Salt Lake.


Snowfall enhancement on the benches was well anticipated by the National Weather Service.  Note in the area forecast discussion below, they comment on the possibility that higher accumulations will occur at low-to-mid canyon vs. near the ridgetop.

Source: NWS
For those of you thinking of recreating in the foothills today the combination of heavy snow and wind has caused the Utah Avalanche Center to issue a Special Avalanche Bulletin that includes benches and steep terrain in the valleys.  Recognize the potential for avalanches on steep slopes and in gullies and avoid them.  Snow can pile up deeply in gullies and thus can be a serious threat for burial.

Source: Utah Avalanche Center
I took the photo below several years ago in the Avenues foothills.  The circumstances were different, but it does illustrate that there are slopes in the foothills, even just above town, that can avalanche.


Snow will continue today, but will become more showery after noon.  To add insult to injury, there is a surge of cold air from Wyoming that is evident in the lower to panels of the NAM forecast below (valid 0600 UTC/2300 MST this evening).  This raises the possibility of cold, easterly, canyon winds tonight and tomorrow morning.  Tough to say at this time if they will be localized or widespread.  


Bottom line: Continue to monitor forecasts and brace yourselves for the coldest weather of the winter.