I've been delinquent on posting about the recent monsoon rains, have now provided measurable precipitation to nearly all locations in the state. Gauge observations of precipitation over the 72-hour period ending at about 8 AM this morning show nearly everyone has gotten something, with a few stations reporting over 1.5 inches.
Source: NWS
In some areas, this has led to flash flooding, especially in southern Utah where such flooding is common during the North American Monsoon. It is a strange combination of beneficial and hazardous weather since precipitation is sorely needed to help vegetation and lessen drought impacts, but can damage property or put lives at risk. Concerning the drought, the latest Drought Monitor shows portions of southern and eastern Utah have gone from exceptional to extreme drought. Statewide, 70% of the state was in exceptional drought last week. Currently that's down to 52%. Progress!
Source: https://droughtmonitor.unl.edu/
For northern Utah, the pattern continues to look active through the weekend. Be alert and prepared for thunderstorms and flash flooding. Although there is a tendency for such storms to be most frequent in the afternoon and evening, the storms that rumbled through the Salt Lake Valley last night show that in this pattern they are possible anytime of day. These are situations where I take a close look at the weather before venturing out, error on the side of caution if I see things deteriorating, and avoid forays into areas where quick retreat isn't possible. This isn't a situation where you want to be committed in lightning exposed or flash-flood prone areas.
Tragedy struck yesterday in a major dust-storm induced crash in Millard County in which at least seven people have been killed and 20 vehicles were involved. Video below provided by Emma Hahne and tweeted by Fox13 shows the visibility impairment in the area.
Video from I-15 this afternoon, near where a 20+ vehicle pileup happened in Millard County, shows how hard it was to see during the dust storm that passed through the area.
Some of the worst vehicle accidents in US history have occurred due to localized visibility restrictions along US interstates. Perhaps not surprisingly, one of the easier summaries to access is provided by the personal injury attorneys Martin, Harding, & Mazzotti (https://www.1800law1010.com/the-worst-traffic-accidents-in-u-s-history/). It provides a list of what they call noteworthy traffic accidents in US history. Scroll down and you will see that dense fog, blowing dust, or sudden snowstorms are often contributors.
For example, on Nov 29, 1991, a massive pileup occurred in a dust storm along I-5 in California. Quoting their web site:
"Due to a severe drought that year, many of the surrounding farmlands had been left unplanted. The high winds whipped up the dry topsoil and created a dust storm that severely reduced visibility, leading to a series of crashes that became a 104-car pileup stretching over a mile of highway. Rescue efforts continued for many hours, and 17 people died while 150 were seriously injured. Several thousand moterists were trapped in their cars for most of the day as road crews worked to reopen the highway. It remains one if the worst traffic accidents in California history."
Media reports indicate that the accident occurred between 4:30 and 5:00 PM MDT between Kanosh and Meadow. Google Maps imagery, which would have been from the day of the accident, shows the region near I-15 consists primarily of farmland, with some areas of less intensively developed land near the base of the Pahvant Mountains to the east.
Source: Google Maps
Radar imagery at 2228 UTC (04:28 MDT) shows some convection over the Pahvant Mountains to the east of Kanosh and Meadow ([Kanosh and Meadow are northeast of Milford (MLF in the image below), just north of the split of I-15 and I-70.
Source: NCAR/RAL
One possible mechanism for strong winds is outflow generated by these cells, which were moving to the southwest. MesoWest observatins within 1 hour ending at 23:30 UTC show easterly surface winds in the Kanosh and Meadow area.
Source: MesoWest
Observations from a portable Road Weather Information System site along I-15 at the southernmost exit for Kanosh showed an increase in wind speed after about 2030 UTC (2:30 PM MDT), with a maximum wind gust of 36.2 mph at 2310 UTC (5:10 PM MDT), very close to the time of the pileup. Temperatures were also declining a few degrees during this period, although there was no abrupt drop in temperature or wind speed as occurs if the outflow featured a sharp gust front. The wind direction during the period of peak winds was E-ESE.
To summarize, blowing dust and reduced visibility appeared to contribute to a major accident along I-15 at around 4:30 PM MDT yesterday afternoon. Meteorological observations suggest that the flow at the time was easterly to east-south easterly and may have been strengthened by outflow from convective showers over the Pahvant Range. The closest observing site to the crash site (UTPR5 above, about 5-10 miles from the crash site depending on precisely where the crash occurred) showed wind gusts over 30 mph beginning around 2200 UTC (4:00 PM MDT) and peaking at 36.2 mph at 2310 UTC (5:10 PM MDT).
These are not exceptional winds or all that unusual during summer convective storms over Utah. Questions remaining to be answered concerns the land-surface conditions east of I-15, whether or not they were conducive for major dust emissions at the wind speeds observed above, and whether or not the flow may have been stronger at the crash site (clever photogrammetry using videos might enable a better estimate). In either event, I suspect that the dust source was from the region between I-15 and the Pahvant range and very likely could have been farmlands close to I-15.
Addendum @ 10:45 AM
Drone footage from UHP is also consistent with local dust source. In the tweet below, I compare their drone photo with one from Google StreetView showing dramatic land-use disturbance immediately to the east of I-15.
Drone photo from UHP at yesterday's dust-storm crash scene vs. image from Google Streetview. Hypothesize land-surface disturbance a critical factor in yesterday's storm with local dust source in easterly flow. pic.twitter.com/p31KrBthfO
In the prior post, we examined the causes of the recent drought in southwest North America. Here we take a look at the Great Salt Lake, a terminal lake with no outlet that fluctuates in elevation and area depending on the water balance of the Great Salt Lake Basin.
New reports in recent days have highlighted that the elevation of the Great Salt Lake is near its historic low. Measuring the elevation of the Great Salt Lake turns out to be a tricky thing. Wind pushes water around and since the 1960s the lake has been divided by an earthen railroad causeway, so the north and south arms sometimes have slightly different elevations.
A news release issued by the USGS on July 16, 2021 indicates that the daily average lake elevation just prior to that news release was 2.4 inches above its historic low and that they expect water levels to continue to decline. The historical trace from the USGS web site is below and shows current levels near the previous 1963 minimum, so we are certainly close.
The Great Salt Lake is a remnant of Lake Bonneville. Geologic evidence suggests that Lake Bonneville began to form 30,000 years ago and at its highest level was over 900 feet deep and covered almost 20,000 square miles. Much of lowland western Utah was underwater.
Source: Wikipedia (prepared by Oviatt, C. G., 2019)
Ah, the good old days.
Approximately 18,000 years ago, Lake Bonneville began to spill across what is known today as Red Rock Pass. Eventually, water burst through the gap and the lake level dropped to what is known today as the Provo shoreline, still well above current lake levels. However, the water balance shifted after this time and lake levels dropped, with Lake Bonneville reaching something near historical Great Salt Lake levels approximately 13,000 years ago. A graph showing a reconstruction of lake levels is below, with time indicated based on thousands of radiocarbon years before present (i.e., 20 = approximately 20,000 years before present).
Source: Oviatt (2015)
As indicated in the first graph in this post, records of Great Salt Lake elevation extend back to 1847 when Salt Lake City was settled by Mormon pioneers. Since then, lake elevation has fluctuated from just under 4192 feet to just over 4211 feet. These fluctuations also affect lake area and salinity. Satellite imagery from yesterday well illustrates the current situation. The lake is confined primarily to Gunnison and Gilbert Bays, the north and south arms of the lake, respectively. The earthen railroad causeway limits mixing between these two bays, resulting in differences in salinity and halophilic bacteria that lead to the color contrast. At historical high stand, the Great Salt Lake would cover virtually all of the lighter playa surrounding it. Evidence suggests that during a prehistoric high around 1700 the lake also covered the playa area further west.
Source: NASA
The primary inflows of water for the lake are precipitation directly onto the lake and inflows from the Bear, Weber, and Jordan rivers. The flow in those three rivers is dominated by spring snowmelt, so wintertime precipitation is a primary driver of lake level.
Since the Great Salt Lake has no outlet, the only way for water to "escape" is evaporation. Thus, the lake level fluctuates based on differences between the above inflows and evaporation.
Since the mid 1800s, humans have altered the water balance of the Great Salt Lake directly and indirectly. The direct effects are related to the capture and use of water along the Bear, Weber, and Jordan rivers for irrigation and other activities. Indirect effects are associated with climate change. Recent work led by Utah State University professor Wayne Wurtsbaugh suggests that water diversions since the 19th century have cumulatively lowered the elevation of the Great Salt Lake by approximately 11 feet. Climate change affects the lake water balance by altering the snowpack, evapotranspiration of ground water in the drainage basin, and rate of evaporation from the lake surface. These effects are expected to lead to lower average lake levels and may be contributing to recent declines. I don't know of a study that has explicitly quantified this effect for the Great Salt Lake, although to date I suspect it is much smaller than that associated with water diversion.
We spoke in the prior post about the slow natural fluctuations in the southwest hydroclimate. Such fluctuations are a wildcard for the short-term future of the Great Salt Lake. A swing to a wetter period could temporarily increase lake levels. A return to the 80s is quite unlikely as tree-ring records indicate that was a very anomalous period, but the lake's trajectory over say the next 10 to 20 years is going to depend a good deal on these slow climate fluctuations. If drought persists, the Great Salt Lake will continue to whither. If we swing back to a wetter period, some recovery may occur.
The long term future is less bright without intervention. Continued water diversion and global warming will further accelerate the decline of the last remnant of Lake Bonneville, with associated collapses of ecosystems and other less desirable effects.
Utah and southwestern North America are currently in a deep drought. Although this year represents the greatest coverage of extreme and exceptional drought in Utah, the reality is that southwestern North America have been in the grips of an extended drought period, sometimes referred to as a megadrought, since about 2000. As described in a paper in Science by Williams et al. (2020), the evidence for this megadrought is apparent in several climate indicators including reduced snowpack, reduced runoff and lake levels, declining ground water availability, drought stress, wildfire activity, etc.
Weather and climate records for southwestern North America only extend back to the late 1800s. However, it is possible to reconstruct past climate using other indicators, such as tree rings. This typically requires the identification of a suitable tree in a representative region, coring of the tree, and measurement and dating of the tree rings. Statistical models are then used to develop relationships between tree rings and climate variables, such as soil moisture, which are then used to "reconstruct" climate back into the past.
Matthew Bekker's Tree Ring lab at BYU does some great work with tree rings in Utah and environs. If you are interested, below is a talk that he gave at the 2013 Restoring the West Conference at Utah State.
A key finding from tree-ring studies is that the climate of southwest North America has experienced extended periods of extreme drought and wetness in the past. Periods of wetness are called pluvials. The causes of these variations in climate are not completely understood, but are likely related to to sea surface temperatures in the Pacific Ocean, which in turn affect mid latitude flow patterns.
The more recent paper by Williams et al. (2020) specifically examines the ongoing megadrought in the southwest United States. Using tree rings, they produced a regional 19-year running-mean reconstruction of soil moisture anomalies in southwest North America. Thus, the time series is designed to focus on long-term (in this case 19 years), wide spread (i.e., averaged over 30-45˚N and 105–125˚W.) climate variations in southwest North America.
The key figure is below, which shows anomalies of 19-year soil-moisture anomalies from 800-2018. In this plot, zero indicates average soil moisture conditions, positive values wetter than average, and negative values drier than average. The red line is the reconstructed time series and the blue line recent observations. Note that there are substantial variations throughout the record. The five droughts and pluvials with the largest negative and positive anomalies are identified with red and green shading, respectively.
A key finding to take from this figure (and other tree-ring studies), is that variations are essentially baked into the southwest North America hydroclimate cake. These variations can be slow and extreme, as occurred from about 1550 to 1650, or more rapid and smaller amplitude, as occurred from about 1700-1900.
In terms of the current drought, the 19-year running mean soil moisture as of 2018 was the 2nd lowest in the reconstruction, exceeded only by the late 1500s megadrought, although there are megadroughts prior to 900, around 1150, and around 1300 that are comparable. From this longer range perspective, the current drought is one of the worst in the past 1200 years.
Williams et al. (2000), however, take it a step further. Using climate modeling and other techniques, they estimate the contribution of anthropogenic (human caused) climate change to the recent soil moisture anomalies, finding a 46% contribution. Basically, recent global warming has taken would would have been a moderate drought and made it one of the worst on record. The current drought is not caused by global warming. Instead, it is exacerbated by global warming.
This is an important distinction. Global warming is shifting the characteristics of the southwest hydroclimate. You could think of it as pulling down that red curve above so that drought tends to be more persistent and severe, whereas the pluvials become less common and less extreme.
Thus, it's not all global warming. What will happen next year or during the next decade is also going to depend on the climate variations described above. At one extreme we are in a period where the climate variations favor drought. Between now and 2030, we see maybe a couple of good snow years, but for the most part, hot and dry persists. At the other extreme, we swing back a pluvial period. Between now and 2030, we see more cool-season snowfall and some recovery of reservoirs and the Great Salt Lake, although that recovery won't be as robust as it might be in a cooler climate.
This is why we need to be cautious about having what I'll call "global warming myopia." Global warming is important, but it is not acting in isolation. It is important to also consider how climate variations, which are cooked into the southwest climate cake, will affect our snow and water resources on yearly to decadal time scales. This is a critical area of scientific research. Reliable guidance on what sort of snow year we will have next year or over the next several years would pay huge dividends for water resource management. Unfortunately, we are not there yet.
Note: There is an Erratum (correction) for the Williams et al. (2020) paper as there was an error in the tree-ring chronology. These errors are described here and have a negligible influence on the results.
Yesterday morning I opened the door at 6 AM for a walk and was blown away by a hot blast. It seemed ridiculously warm.
Indeed, the remarkably high 82˚F minimum temperature mentioned in yesterday's blog post held up for the calendar day held up as the minimum for the day, setting a new all-time record for the highest minimum temperature.
Below are the 63 highest minimum temperatures observed in Salt Lake City (basically, every day with a minimum of 77˚F or higher). You will likely noticed something not all that surprising. A supermajority (about 78%) have occurred in the 21st century.
Additionally, yesterday was the hottest day on record in Salt Lake City, with an average temperature [i.e., (Tmax+Tmin)/2] of 93˚F thanks to a maximum temperature of 104˚F. This was a full 1.5˚F warmer than the previous record of 91.5˚F set on 15 July 2007. There are 19 days on record with an average temperature of 90˚F or higher, and all but 2 of them have occurred in the 21st century.
A shift in the wind overnight has given us a temporary reprieve from the smoke in the Salt Lake Valley, but brought in some clouds that kept it remarkably warm overnight.
Many of the features in yesterday (Monday) morning's sounding at the Salt Lake City airport were typical of July with an inversion at the surface (which burns off rapidly with morning heating) and then what is known as an "inverted V" profile up to about 500 mb. The inverted V is characteristic of something known as the residual layer, a remnant of the previous days boundary layer in which thermals generated by surface heating mix the atmosphere. The flow was light at low levels and northwesterly aloft, the latter bringing in smoke from upstream sources.
Source: SPC
This morning there are two key changes. First, the flow has increased and shifted to southerly at low levels and shifted to southwesterly aloft. This is why we are getting a temporary reprieve from the smoke. Second, clouds and moisture have moved in at mid levels, near 500 mb.
The increased low-level flow and cloud cover led to a remarkably warm night. The overnight minimum at the Salt Lake City International Airport was only 82˚F. It's possible that it dipped below that a degree or so after 6 AM when we get the minimum temperature report (the next update is at noon), but regardless, minimums in the low 80s are ridiculously high. The highest minimum temperature ever observed at the airport is 81˚F and there have only been three days with a minimum of 80˚F or higher. To be official, however, it has to survive through the calendar day, so much will depend on what happens later today and this evening.
For that period, we will have to see if the monsoon convection decides to do more than tease us. As illustrated by the HRRR forecast valid 2300 UTC (5 PM MDT) this afternoon, we are right on the edge of showers and thunderstorms focused mainly in central and southern Utah. This may be a case of close but not close enough unless things shift northward a bit.
What about the smoke? There's so much smoke everywhere that it's perhaps a bit of a miracle that we're as clear as we are this morning. Check out the satellite image from 1441 UTC (0741 MDT).
Source: CIRA
If one believes the HRRR, "periods of smoke" is probably the best forecast one can make. The air to our south and southwest is less smoky at low levels, but to our north and west is quite smoky. Given the shifting winds over the next day or two, we will probably see a lot of variability in smoke. You can see in the smoke forecast for 0600 UTC (midnight) tonight that high smoke concentrations come in with a shift to northwesterly flow tonight, but there are lower concentrations just to the south. Subtle variations in the wind will make a pretty big difference.
My advice is to take advantage of clear periods and get your exercise in when the getting is good.
We returned to Hades from our Northwest vacation late yesterday. Sadly, we awoke this morning to an apocalyptic scene thanks to heat and smoke from fires in Oregon and California. Below is the view from my morning ride on the BST in the Avenues foothills.
Although we suffered through the Seattle heat wave and it was beginning to get uncomfortable on our last day of hiking in the central Oregon Cascades, for the most part, we had enjoyable weather for our time in Southeast Alaska and on the Oregon coast. Below are a few photos in case you miss clear skies and sub-80˚F temperatures.
Let's take a peak at the meteorological insanity of the past few weeks. June was blistering hot across the Great Basin and adjoining region. The map below was produced by Brett Brettschneider (@climatologist49 on Twitter) and shows the temperature ranking for counties in the contiguous US during that fateful month. Every county in Nevada, all but 2 in Utah, and many counties in California, Arizona, and Idaho observed their hottest June on record. A few counties in the PacNW did as well.
For much of that region, things have only worsened in July. Chances are you've seen some of the recent numbers. St. George hit 117˚F yesterday, which ties the hottest reading recorded in Utah (still waiting on whether or not this will be recognized officially as the state record). Grand Junction also set an all-time high a couple of days ago. Death Valley? How about a high of 130˚F, which is probably the hottest they've recorded since serious concerns have been raised about the validity of their 134˚F in the first part of the 20th century. Overnight, the low in Death Valley was around 107˚F. That may be the highest minimum ever recorded in North America, although I'm waiting for confirmation on that.
Shall we take a peak at Salt Lake City? The average temperature from 1 June to 10 July was 81.5˚F, a number that is 2.9˚F higher than the next closest year (2017) and 4.7˚F higher than the closest 20th century year (1988).
http://xmacis.rcc-acis.org/
Ah, the 20th century. The good old days. Are you old enough to remember when 1988 was the hottest on record in Salt Lake City? Thanks to the Internet, you can either visit or revisit that summer and what people thought of it.
Summer 2021 is not in the bag yet, but I suspect any of us would take a repeat of summer 1988 over what we've experienced so far.
I noticed it hit 100 today in Salt Lake City, with a forecast of 101 for tomorrow. Good luck with that.
We are still enjoying the maritime climate of Ketchikan, Alaska. I've done most of the hikes around here before, but don't mind doing them again.
If you've never hiked here before, let me give an introduction. The first thing to remember is that the forests are impenetrable. If the devil's club and other prickly bushes don't get you, the mud and muskeg will. Stay on the trail? Essential, except in a few places above treeline.
The old-school trails here are similar to the one below, with wooden treadways. I can't even fathom how long it must have taken to put these in.
More recently, they've shifted to using gravel, which I suspect lasts longer and isn't slippery when wet, although I always liked the wooden planks and the thrill when they don't break with each foot stomp.
Although I love airy summits, the forests here are incredible. The life force is strong. I'm a bit disappointed that it's been dry since we arrived since I enjoy lowland hikes in the rain here.
Yesterday was cloudy and cool. We did a short, steep hike up Dude Mountain into the alpine, such as it is here. It was lush where there wasn't snow.
Skis would have been fun in a few spots.
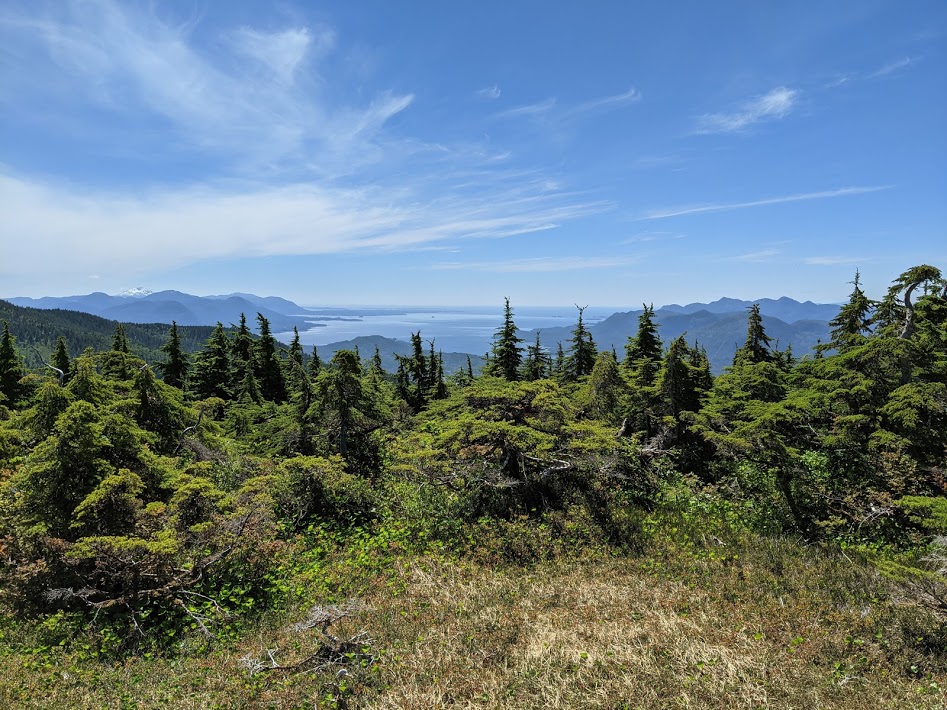
Today was five star, but "hot." It looks like there will be a high of 73˚F at the Ketchikan airport! I climbed Minerva Mountain and worked up quite a sweat. I should have brought more water. A few views of the nearby water ways and snow-capped mountains. Visualize breathing the maritime air.
I've been here both for dry, warm weather and rain, most commonly the latter. We were here once for the Christmas Holidays and it rained and blew continuously for days. It was like living in a car wash and probably the closest one can come to experiencing living underwater. I was a runner at the time and it took about one or two blocks before I was soaked to the skin as not only was it raining hard, but it was blowing hard too. According to the Western Region Climate Center, Ketchikan averages 152" of precipitation a year, roughly TEN TIMES the annual precipitation at the Salt Lake City airport, which is even more impressive when you realize that thunderstorms are rare here. June and July are the dry season, but each month averages over 7 inches, more than Seattle in its wettest month. Such is life at the end of the Pacific storm track.