Tuesday, November 29, 2022

Pretty Good Storm

Things came together nicely yesterday and continue this morning in the form of lake effect to give us a pretty good storm for the central Wasatch.  The Utah Avalanche Center reports totals in the central Wasatch of 10-15" of cold smoke (5-6% water content) through 5 am.  Through 6 am, the Alta-Collins automated snow-depth sensor has recorded 14", Canyons-Daybreak 15", and Deer Valley-Ontario 10".  To the north, Snowbasin-Boardwalk is clicking in with 11".  Perhaps Mountain Dell has gotten enough that with some effort the Nordic track can be set.  I'm always amazed at what the groomers can do there.  

At around 11 UTC (4 AM MST), precipitation features began to form over the Great Salt Lake (apologies for the old lake outline in the loop below) and began to train off into the north Salt Lake/east Salt Lake Valley area.  The lake effect continues through the end of this loop at 1356 UTC (0656 AM MST).  

My expectation is that these lake-effect snow showers will eventually taper off this morning. 

Another storm for Thursday night/Friday.  Consider yourselves blessed.  

Monday, November 28, 2022

Snow Returns

I've felt quite conflicted the past week as we have a robust snowpack for late November, but ski conditions at the resorts have been scratchy, whereas a multitude of crusts and other less-than-desirable snow surface have predominated in the backcountry.  Touring on Saturday, I had 3 good turns and 97 bad ones (that's an estimate).  Far be it from me to complain given the healthy snowpack, but we need snow. 

The good news is we are going to get it with an upper-level trough and associated frontal system moving through the area today and tonight.  The 0600 UTC initialized GFS forecast valid 2100 UTC 28 Nov (2 PM MST Monday) shows the upper-level trough axis over Nevada, the 700-mb trough over northern Utah, and a mixture of orographic (i.e., mountain induced) and frontal precipitation over northern Utah and extending upstream across Nevada, Idaho, and Oregon.  


The corresponding GFS time height section shows moisture aloft this morning with dry (lower relative humidity) air at low levels over the valley.  Low-level trough passage occurs just before 2100 UTC (2 PM) and is accompanied by a shift of low-level winds to northwesterly and deeper moisture.  Even in the valley, snow is likely this afternoon with travel impacts.  

After that, we are in deep, moist, unstable flow.  This is a good situation for post-frontal snowshowers in the mountains.  Additionally, the 1200 UTC initialized HRRR is generating a lake-effect band tomorrow morning.  

However, our Great Salt Lake Forecast Guidance, which is derived from the GFS, has low lake-effect probabilities overnight (< 20%) increasing in the morning, with Bountiful favored.  


A look at the GFS time-height section above illustrates why the GFS is less excited as it forecasts the low level flow to be mainly from the west to the west-northwest.

In contrast, the HRRR time height has more NW flow (note that this is the 1200 UTC initialized HRRR, so there is a 6-hour time shift in the times plotted in the time-height below compared to the GFS above) and a more favorable pattern for lake effect.  


There's no reason to rate one model above the other.  One of the reasons why lake-effect is fickle, and why meteorologists call it the Dreaded Lake Effect, is that there is sensitivity to the details of the large-scale flow.  Tonight is a situation where lake-effect is possible, but we really can't say much yet about intensity or location.  

For Alta/Little Cottonwood, our GFS-derived product shows light precipitation through about noon when things pick up with the approach of the trough.  Through 7 PM this evening, the GFS generates 0.58" of water at Alta Collins, which translates to about 8" of snow.  


After that, the GFS adds another 0.29" of water through Tuesday afternoon and a bit over 5" of low-density snow, bringing the storm total to 0.87"/13.8".  That would be a Goldilocks storm if ever there was one.  

The HRRR is pretty close to the GFS through 7 PM (0.51" of water) but is much snowier overnight with more post-frontal and lake-effect precipitation, bringing the storm total by 2000 UTC (1 PM MST) Tuesday afternoon to 1.61" at Alta-Collins.  


We haven't plugged our snow-to-liquid ratio algorithms into the HRRR output yet, but I suspect that would be a storm total of a bit over 24" of snow if it verifies.  

I'll go with 6-12" at Alta-Collins through 7 PM tonight with the frontal passage.  After that, a lot will depend on the post-frontal crap shoot, but a storm total of 12-18" seems likely through Tuesday afternoon, with greater amounts if the post-frontal instability showers or lake-effect can get going with crosshairs aimed at the central Wasatch.

Sunday, November 27, 2022

ECMWF HRES Now on weather.utah.edu

 By popular demand, output from the the European Center for Medium Range Weather Forecasting (ECMWF) High Resolution Forecast (HRES) is now available on weather.utah.edu.

The HRES goes by many names.  It is sometimes called the ECMWF, the EC, the Euro, or even one of those with "Deterministic" added to the end (e.g., the EC Deterministic).  On weather.utah.edu I am labeling it the HRES because that is what the ECMWF calls it.

The HRES is a global forecast produced using ECMWFs Integrated Forecast System (IFS) with an effective grid spacing of approximately 9 km.  It is the highest-resolution and on average the most accurate global forecast produced by any forecast center.

Much is made about the rankings of the various forecast models, but it is a bit like the NFL standings.  Some teams are better than others, but on any given Sunday, upsets happen.  One metric of model performance is the 5-day forecast 500-mb geopotential height anomaly correlation coefficient, a measure of the accuracy of the upper-level flow pattern.  Below are the 500-mb geopotential height anomaly correlation coefficients from several major global forecast models over the past month.  The HRES (labeled ecm below, red line) is consistently near the top, but there are days when the UK Met Office (ukm, yellow-brown), GFS (black), or Canadian (CMC, green line) beat it.  

Source: NOAA/NWS/NCEP

Thus, it is best to use the HRES not in isolation, but in consultation with other forecast modeling systems.  

In the United States, operational forecast model output is freely available and not subject to copyright.  This is why I can create and distribute plots based on the GFS and HRRR on weather.utah.edu.  This is not the case for ECMWF model output.  Only recently has ECMWF begun to provide some of the forecast model guidance publicly.  The new HRES plots on weather.utah.edu are based on ECMWFs "Open Data" feed, which is governed by the Creative Commons CC-4.0-BY license so that plots can be created, distributed, and provided publicly.

That being said, the open data HRES dataset is produced at 0.4˚ grid spacing (the HRES runs at about 0.1˚) and only a limited number of variables are available.  For the 00 UTC and 12 UTC runs, forecast products are available every 3 hours to 144 hours and every 6 hours from 150 to 240 hours whereas for the 06 UTC and 18 UTC runs products are only available to 90 hours.  Products are also available relatively late.  

On weather.utah.edu you will see two options for the HRES, "ECMWF HRES (240 h)" which will provide the 00 and 12 UTC initialized runs to 240 h and "ECMWF HRES (90 h) which will provide all four runs to 90 h.  The plots are the same as those produced for the GFS 0.25˚ grids except: (1) there are no dynamic tropopause products available, (2) vertical velocity is not available on the synoptic plots, and (3) synthetic satellite imagery (OLR) is not available).  Below are comparisons of last night's 00 UTC HRES and GFS forecasts valid 0000 UTC 29 November (5 PM MST Tuesday).


Higher-resolution HRES products for the US are available at Pivotal Weather (free) and at some subscription sites.  These providers are either paying to provide HRES in this way or they have an alternative ECMWF license.  

Even with limitations, I hope you find these products useful. 

Monday, November 21, 2022

Slim Chances for Thanksgiving Eve

I've been watching the models over the past few days hoping of a clear sign of a major storm during the Thanksgiving weekend, but one does not exist.  Most of the models and ensemble members say we will see little to no precipitation, but there are a small number that give us a bit more love.  

The GFS is one of the models that gives us a bit more love.  Below is the 0600 UTC initialized GFS forecast valid 1200 UTC (5 AM) Wednesday (Thanksgiving Eve).  It brings a short-wave trough that most of the models and ensemble members keep to our north a bit farther south and across northern Utah.  

As a result, the GFS does generate some snowfall for northern Utah, especially in the northern Mountains, on Thanksgiving Eve including about 0.49" of water equivalent at Snowbasin and 0.47" at Powder Mountain.  Amounts are lower in the central Wasatch.   

That would translate into about 7 inches in the northern mountains and 4 inches in the central Wasatch. 

This is, however, an outlier solution.   The 0000 UTC initialized ECMWF keeps the short-wave trough and associated precipitation to the north and gives us nothing.  

About half of the downscaled NAEFS members give Alta-Collins scant amounts, but there are some that are more excited, including one that goes off with almost 1.5" of water and 25" of snow.  

So, slim chances that we get something Thanksgiving Eve, but a slim chance is better than no chance.  Expect nothing.  Hope for something.  If we get something, be sure to give thanks.

Friday, November 18, 2022

Epic Lake-Effect Event

Sure Alta, Snowbird, and Snowbasin are opening today, but it is the Great Lakes snowbelts that are getting the goods today.  It's always a "good" sign when Jim Cantore comes to town and he measured 32" south of Buffalo in Hamburg, NY this morning.  


Satellite and radar imagery at 1445 UTC (945 AM EST) showed an intense long-lake-axis-parallel (LLAP) snowband extending along nearly the entire length of Lake Erie and across the southern portion of the Buffalo Metro Area.  Another LLAP snowband extended downstream of Lake Ontario into the western Adirondacks. 

LLAP snowbands can develop during flow along the long axis of elongated lakes like Lakes Erie and Ontario.  They tend to produce intense snowfall rates, sometimes exceeding 4 inches an hour (we measured up to 5.5" in an hour once on the Tug Hill Plateau east of Lake Ontario and I have seen unofficial reports of 5" an hour this morning from Hamburg), with no snow to the north and south of the band.  At the time of the radar image above, for example, there would have been no snow falling in the northern Buffalo Metro Area and Niagara Falls just to the north of the LLAP snowband. 

Note that the character of the lake-effect snow east of Lake Michigan is completely different.  Instead of a LLAP snowband, there is broad coverage of multiple small-scale snowbands.  This is common during flow across the long axis of elongated lakes.  Lake Michigan can produce LLAP snowbands, but typically during northerly flow when the flow is along the long-lake axis.  When the flow is from the west and across the long-lake axis, as is the case above, it typically produces broad coverage lake effect.  Broad coverage lake effect covers a larger area, but typically with lower peak snowfall rates than LLAP snowbands.

In this case, Lake Michigan is upstream of Lake Erie and it is probably contributing to the intensity of the Lake Erie LLAP band by moistening and destabilizing the flow before it moves over Lake Erie.  The initiation of the Lake Erie snowband very close to the upstream shore is consistent with the upstream airmass being primed and ready to go as it moves over the lake.  This is sometimes referred to as an aggregate lake effect, or a lake-to-lake connection.  The intensity of Lake Erie and Lake Ontario snowbands is not always due entirely to local lake influences, but also to upstream lake influences.

Incredibly, this event has a ways to go.  We will see some big snowfall totals, especially if the band can lock in instead of vacillating around like a loose firehose.  

Sunday, November 13, 2022

Fall Break

It was a great run over the past couple of weeks with some of the best early season skiing seen around here in the past 30 years.  

Coverage after last week's storm was quite impressive and for November 12, likely the 2nd best since 1990 based on long-term observations from the Snowbird SNOTEL.  Pent up desire was apparent in both the backcountry and at the resort with hoards of skiers ascending into the Cottonwood Canyons backcountry and resorts.  


Sadly, the powder party is over for now as the pattern is shifting fairly dramatically.   Call it "Fall Break."  The GFS forecast below shows a high amplitude ridge developing along the west coast of North America early this coming work week (forecast below for 5 PM MST Tuesday).  

This ridge will dominate the upper-level flow and the relatively dry, cold northerly flow downstream of it will dominate the pattern in our region through next weekend.  

Precipitation for northern Utah is scant in the GFS through 1200 UTC (5 AM MST) Sunday 20 November.

Source: Pivotal Weather

And the Euro agrees. 

Source: Pivotal Weather

A few members of the NAEFS give us a few snow showers over the next couple of days (most of these will stay in southern Utah), and a few Canadian members some action toward the weekend, but pickings are mainly slim.  


All good things must come to an end.  Please go to work and let the Wasatch have some rest.  

Thursday, November 10, 2022

A Deep Dive into the Great Salt Lake Effect

This is a reproduction of a report prepared and presented to the Great Salt Lake Advisory Council at their 14 September 2022 meeting.  It has been modified for formatting, to remove personal information, and to correct a few typos.  I thank students and colleagues whose research or comments contributed to and improved the manuscript.

Contributions of Lake-Effect Periods to Precipitation and Streamflow in Northern Utah

W. James Steenburgh
Professor of Atmospheric Sciences
University of Utah

Executive Summary

Lake-effect periods are sometimes produced during cold-air outbreaks over the Great Salt Lake, contributing to snowfall and streamflow in the surrounding mountains. Prior research indicates that precipitation produced by lake-effect periods is greatest south and southeast of the Great Salt Lake and contributed 5.1-8.4% of the cool-season (16 September – 15 May) precipitation at observing sites in the Cottonwood Canyons and Oquirrh Mountains from 1998–2009. During this study period, the lake was at or below its average historical area. No studies have carefully examined the long-term influence of lake area on lake-effect precipitation or the contribution of lake effect to streamflow, underscoring the need for further research in these areas. Studies do indicate that salinity reduces the coverage and intensity of lake-effect storms and could exacerbate precipitation losses should lake levels and area continue to decline.

1. Introduction

The Great Salt Lake is the largest body of water in the contiguous western United States and the largest salt lake in the western hemisphere. It is a terminal lake with no outlet, so its elevation and area change because of variations and trends in climate, including snowfall, streamflow, and evaporation, as well as water diversions for human activities. Historical levels at Saltair on the south shore have been as high as 4211.6 feet in 1986 and as low as 4190.4 in 2021, although preliminary data indicate that the lake dropped below this level during the summer or 2022 (Lake surface elevations based on the USGS observing site at Saltair Boat Harbor (1001000) and based on National Geodetic Vertical Datum of 1929 (NGVD 1929). Elevations north of the Union Pacific rock-fill railroad causeway may differ after completion of its construction in 1959.).  Correspondingly, the lake area has been as large as 3,300 square miles and as small as 950 square miles (Figure 1).

Figure 1. Landsat satellite imagery of the Great Salt Lake based on data collected in September 1987 (left) and April/May 2021 (right) when the lake was near its high and low stands, respectively.  Images courtesy of the U.S. Geological Survey.  

Due to the accumulation of sodium chloride and other salts, the Great Salt Lake is hypersaline and much saltier than ocean water. There is a stark salinity contrast between the northern and southern halves of the lake, which are separated by a rock-fill railroad causeway that limits mixing between the two halves. The northern half receives very little freshwater inflow and typically has a salinity near 27%. The southern half receives most of the freshwater inflow and has a salinity that has been as low as 6% during higher lake stands, but since 2010 has varied between 10 and 18%. For comparison, ocean water has an average salinity of 3.5%. Lake salinity can be locally low near freshwater inlets.

The Great Salt Lake is also very shallow. At an elevation of 4200 feet, it has an average depth of 16 feet and a maximum depth of 33 feet. As a result, the lake-surface temperature responds relatively quickly to changes in air temperature associated with fronts and other weather systems. It also warms quickly in the spring, which contrasts with larger, deeper lakes such as the Great Lakes of eastern North America, which tend to warm or cool more slowly in response to weather systems and seasonal changes. During winter, because of its salinity, the Great Salt Lake develops little ice and can achieve low temperatures (near 28˚F). 

The Great Salt Lake has multifaceted influences on the climate and water resources of northern Utah. As directed by the Utah Department of Natural Resources and Great Salt Lake Advisory Council, this report summarizes current understanding of the influence lake-effect precipitation generated by the Great Salt Lake on precipitation and streamflow.

2. The Great Salt Lake effect

a. What is lake-effect precipitation? 

Lake-effect precipitation is precipitation that is produced or enhanced when cold air passes over a relatively warm body of water. This occurs due to the transfer of heat and moisture into the atmosphere, which destabilizes the atmosphere and leads to atmospheric circulations that initiate and organize clouds and precipitation systems. Lake-effect and related sea- or ocean-effect precipitation often falls as snow, although it can fall as rain, especially in the fall or spring at lower elevations in warmer climates. The most prolific lake-effect snowfall occurs in the snowbelts near the Great Lakes of eastern North America and in the heavy snow region of Japan near the Sea of Japan where frequent cold-air outbreaks occur over large water bodies. Less prolific but sometimes disruptive lake-effect storms can also be produced by smaller water bodies including the Great Salt Lake, Utah Lake, Bear Lake, Pyramid Lake, and Lake Tahoe. The water that falls in these storms can be traced back to both the upstream atmosphere and evaporation from the lake surface. For small lakes, upstream moisture is often critical for lake-effect development.

b. Characteristics of the Great Salt Lake effect

Great Salt Lake-effect precipitation occurs most frequently during cold-air outbreaks following the passage of a cold front when the flow is westerly, northwesterly, or northerly. The development, intensity, and coverage of lake-effect precipitation depends on several factors including the lake temperature and salinity, air temperature and humidity, wind direction and speed, and other factors. Additionally, low-level flow convergence frequently initiates and organizes lake-effect clouds and precipitation. Such convergence can be produced by flow interactions with the topography or land breezes from the lake shorelines (Figure 2).

Figure 2: Schematic depiction of the convergence of land breezes and the development of a lake-effect storm over the Great Salt Lake.  Source: Steenburgh (2014).  © University Press of Colorado.

Most Great Salt Lake-effect precipitation periods are disorganized and produce scattered or widespread precipitation (Figure 3a). Sometimes they organize into narrow bands that produce heavy, localized snowfall with rates that can approach 3 inches per hour (Figure 3b). It is also possible for lake effect to enhance or occur simultaneously with other precipitation features (Figure 3c). For this reason, it is not possible to completely disentangle lake-effect and non-lake-effect precipitation.

Figure 3. Radar imagery of a) widespread lake-effect precipitation, b) banded lake-effect precipitation, and c) lake-effect precipitation with other precipitation features.  Source: Alcott et al. (2013).  © American Meteorological Society. 

The ability to identify and monitor Great Salt Lake-effect precipitation increased significantly in 1994 with the installation of a NOAA/National Weather Service radar on Promontory Point. The characteristics described below are based lake-effect periods identified during the 1998 to 2010 cool seasons (16 September to 15 May). During this study period, the area of the Great Salt Lake declined from 1750 to 1200 square miles, which corresponds to near average (1700 square miles) and roughly halfway between average and the historical minimum (950 square miles).

During this study period, there were an average of 13 lake-effect periods per cool season with as few as 3 in 2005 and as many as 20 in 2010. Many of these periods were short lived, with less frequent but intense periods responsible for most of the precipitation accumulation (see section 2c). Lake-effect periods were most common from mid-October to mid-December and in early April. The early April peak is unusual compared to other bodies of water that are deeper and tend to be cold in the spring. In contrast, the shallowness of the Great Salt Lake allows it to warm rapidly, enabling it to generate lake-effect precipitation in the spring when a cold-air outbreak occurs after a warm period.

c. Contribution of lake-effect periods to cool-season precipitation

Estimating the contribution of lake-effect periods to cool-season precipitation and snowpack is not straightforward. For the estimates below, we identified lake-effect periods using radar imagery from the 1998–2009 cool seasons and determined how much precipitation they produced at National Resources Conservation Service (NRCS) Snowpack Telemetry (SNOTEL) stations. The estimates include some non-lake-effect precipitation since there are times when lake effect enhances or occurs with precipitation produced by other weather systems. On the other hand, it is possible that the lake influences or enhances some mountain snowstorms in ways that are not easily identified in radar.

During the study period, precipitation during lake-effect periods was greatest at SNOTEL stations in the Cottonwood Canyons and the Oquirrh Mountains (Figure 4a). In the Cottonwood Canyons, the average cool-season water equivalent precipitation during lake-effect periods was 2.06 and 2.38 inches at the Mill D North (Big Cottonwood Canyon) and Snowbird (Little Cottonwood Canyon) SNOTEL stations, respectively. In the Oquirrh Mountains it was 2.12 and 2.37 inches at the Rocky Basin-Settlement (Settlement Canyon) and Dry Fork (Butterfield Canyon) SNOTEL stations, respectively. In the Wasatch Range, average cool-season liquid equivalent precipitation during lake-effect periods generally decreased northward of the Cottonwood Canyons with 1.46, 1.61, 1.59, and 1.01 inches at the Parleys Summit, Lookout Peak, Farmington, and Ben Lomond Peak SNOTEL stations, respectively. Values at other stations ranged from 0.33 to 1.32 inches, the latter at the Payson Ranger Station southeast of Utah Lake. At some of these sites, especially those in the Bear River Range and western Uintas, much this precipitation was produced by non-lake-effect precipitation features that occurred simultaneously with lake-effect precipitation.

Figure 4. a) Water equivalent of precipitation during cool-season (16 September – 15 may) lake-effect periods during the 1998–2009 water years.  b) Fraction of cool-season precipitation produced during lake-effect periods during the 1998–2009 water years.  Lake shores based on high and low stands during the study period with Bear, Weber, and Jordan–Provo River Basins annotated.  Data from Yeager et al. (2013). 

The average fraction of total cool-season precipitation produced during lake-effect periods was 8.4% and 6.3% at Dry Fork and Rocky Basin-Settlement in the Oquirrh Mountains and 5.9% and 5.1% at Mill D North and Snowbird in the Cottonwood Canyons (Figure 4b). The Oquirrh Mountains are drier than the Cottonwoods during non-lake-effect periods, yielding the higher fractions. The lowest fractions are at the Ben Lomond Peak and Trail SNOTEL stations in the northern Wasatch (2.0% and 1.6% respectively).

Observations from Snowbird provide additional insights into the characteristics of lake-effect periods. During the 12 cool-season study period, just 13 lake-effect periods, or about 10% of the periods, produced 50% of the lake-effect precipitation at Snowbird. Thus, approximately one large storm per year was responsible for half of the lake-effect precipitation at Snowbird, equating to about 1.2 inches of water equivalent. From year-to-year, the amount of cool-season precipitation during lake-effect periods at Snowbird varied from as high as 5.04 inches in the 2002 water year (about 12% of the precipitation that cool season) to as low as 0.51 inches in the 2003 water year (about 1% of the precipitation that cool season). Such a wide swing in back-to-back years illustrates that year-to-year variations in lake effect cannot be explained solely due to changes in lake area. Meteorology, especially the frequency and characteristics of cold-frontal passages and associated cold-air outbreaks, also plays an important role. Lake area could have longer-term implications for precipitation, however, as discussed in section 2e.

d. Contribution of lake-effect periods to streamflow

For northern Utah and the major drainage basins of the Great Salt Lake, between 50% and 80% of the annual streamflow occurs during the four-month period of snowmelt (April through July), but even during low-flow periods stream water is predominantly composed of snowmelt that recharged groundwater and is released slowly during the year. The percentage varies from basin-to-basin and from year-to year depending on many factors including the altitude, aspect, and other geographic and ecological characteristics of the basin, antecedent groundwater storage, amount of precipitation that falls as snow and is retained in the end-of-season snowpack, and whether it is a high or low snow season.

To our knowledge, there are no peer-reviewed studies estimating the contribution of lake-effect precipitation to streamflow in any northern Utah hydrologic basin. The estimates in section 2c are the contribution of lake-effect periods to precipitation, which is not equivalent to the contribution to streamflow. With these caveats in mind, we provide some discussion below for general guidance but emphasize that further research is needed.

As discussed in section 2c, the amount of precipitation produced during lake-effect periods is greatest in the Cottonwood Canyons and the Oquirrh Mountains. However, it is likely that the percentage of lake-effect precipitation that is converted to streamflow is higher in the Cottonwoods where there is more high altitude, north-facing terrain and the climatology favors greater precipitation and a deeper snowpack. These factors favor a greater conversion of precipitation to streamflow. Therefore, we anticipate that lake effect contributes to a larger volume of streamflow in Little and Big Cottonwood Creeks than to the creeks issuing from the Oquirrh Mountains. It is possible, however, that lake effect contributes a larger fraction of streamflow to the creeks issuing from the Oquirrh Mountains where precipitation during non lake-
effect periods is lower than in the Cottonwoods.

As described in section 2c, lake-effect periods produced on average 5.1–5.9% of the precipitation at SNOTEL sites in the Cottonwood Canyons during the 1998–2009 cool seasons. It is not known if the contribution of lake effect to streamflow in Little and Big Cottonwood Creeks scales similarly, but we suggest that it may be close. It could even be slightly higher. This is because lake-effect storms tend to be colder, with lower snow levels, thus contributing to a greater fraction of the snowpack at low elevations. Additionally, the addition of lake-effect snow may increase the streamflow yield even the non-lake-effect by creating a deeper snowpack. On the other hand, these relatively low numbers illustrate that non-lake-effect precipitation is the primary driver of streamflow in the Cottonwood Canyons.

The difficulty in relating the small amounts of precipitation associated with lake-effect storms to streamflow arises primarily from the high site-to-site and year-to-year variability in runoff efficiency. In Little Cottonwood Canyon average annual streamflow is 63% of average annual precipitation, but that value ranges from 45% to 80% from year to year. In Big Cottonwood Canyon average annual streamflow is 49% of average annual precipitation but values range from 32% to 65%. Thus, the natural variability in streamflow generation is significantly larger than the lake effect. In addition, a warming climate is resulting in snowmelt beginning earlier and less efficient streamflow generation/ runoff efficiency. Lake-effect snow in the spring can also act to increase how much sunlight is reflected by snow surface, which may delay the melt following a storm. This is likely a small effect but would contribute to more efficient
streamflow generation.

e. Influence of lake size on precipitation

In any given year, lake-effect precipitation depends on lake characteristics and meteorology. During the 1998–2009 study period when the Great Salt Lake area declined from 1750 to 1200 square miles, lake area poorly explained year-to-year variations in lake-effect precipitation. The three biggest lake-effect seasons at Snowbird, for example were 2002 when the lake area was near the 1500 square mile average for the study period, 1998 when the lake area was near the 1750 square mile maximum for the study period, and 2009 when the lake area was near the 1200 square mile minimum for the period. This is because the characteristics of cold-air outbreaks that occur each cool season, especially those that contribute to intense lake-effect periods, also affect lake-effect precipitation. This obscures the signal of lake area if one examines a relatively short period of about a decade.

Nevertheless, it is likely that lake area does influence the characteristics of lake-effect storms and that this would be detectable over a longer record of multiple decades or potentially illustrated using regional climate modeling. We are unaware of any peer-reviewed studies that have attempted to do this. Further, we suggest that there may be tipping points at which a small change in lake elevation (and area) produce is a significant shift in lake-effect characteristics. Lake elevation affects not only area but also shape, which in turn influences the characteristics of lake-effect storms. At high-stand (4211 feet) and 4200 feet elevations, the Great Salt Lake occupies the Farmington and Bear River Bays (Figure 5). However, near and below the historical low stand (4291 feet), the lake is confined to an elongated region along the axis of the North and South Arms. At these levels, the lake is quite narrow, potentially reducing the range of flow directions that can effectively generate lake effect. For lower lake levels, declines in lake-effect precipitation might be greater, for example, in the Bountiful-area mountains than in the Oquirrh Mountains. Research is needed to explore these effects.

Figure 5. Great Salt Lake coverage at 4211 feet (high stand), 4200 feet (historical average), 4191 feet (low stand), 4180 feet, and 4170 feet.  Great Salt Lake bathymetry source: Tarboton, D. (2017). Great Salt Lake Bathymetry, HydroShare, http://www.hydroshare.org/resource/582060f00f6b443bb26e896426d9f62a. Hillshade sources: Esrii, USGS, FAO, NOAA. 

f. Influences of lake salinity on snowfall

Salinity reduces the transfer of water from the lake to the atmosphere through evaporation. The reduction increases with salinity, especially at high salinities like those found in the north half of the lake. Due to the contrast in salinity, the transfer of water from the lake to the atmosphere through evaporation tends to be greater over the south half of the lake than the north half.

Scientists have incorporated these effects into computer model simulations of lake-effect storms. For one event, the salinity produced a 17% reduction in snowfall compared to a simulation with fresh water. It is likely that increases in salinity accompanying a shrinking Great Salt Lake, which would mainly occur in the south half of the lake, would further reduce lake-effect precipitation.

3. Sources and bibliography 

Alcott, T. I., and W. J. Steenburgh, 2013: Orographic influences on a Great Salt Lake-effect snowstorm. Monthly Weather Review, 141, 2432–2450.

Alcott, T. I., W. J. Steenburgh, and N. F. Laird, 2012: Great Salt Lake-effect precipitation: Observed frequency, characteristics, and environmental factors. Weather and Forecasting, 27, 954–971.

Bardsley, T., A. Wood, M. Hobbins, T. Kirkham, L. Briefer, J. Niermeyer, and S. Burian, 2013: Planning for an uncertain future: Climate change sensitivity assessment toward adaptation planning for public water supply. Earth Interactions, 17, 1–26, https://journals.ametsoc.org/view/journals/eint/17/23/2012ei000501.1.xml.

Brooks, P. D., A. Gelderloos, M. A. Wolf, L. R. Jamison, C. Strong, D. K. Solomon, G. J. Bowan, S. Burian, X. Tai, S. Arens, L. Briefer, T. Kirkham, and J. Stewart, 2021: Groundwater-mediated memory of past climate controls water yield in snowmelt-dominated catchments. Water Resources Research, 57, e2021WR030605. https://doi.org/10.1029/2021WR030605.

Onton, D. J., and W. J. Steenburgh, 2001: Diagnostic and sensitivity studies of the 7 December 1998 Great Salt Lake-effect snowstorm. Monthly Weather Review, 129, 1318–1338.

Steenburgh, W. J., and D. J. Onton, 2001: Multiscale analysis of the 7 December 1998 Great Salt Lake-effect snowstorm. Monthly Weather Review, 129, 1296–1317.

Steenburgh, W. J., S. F. Halvorson, and D. J. Onton, 2000: Climatology of lake-effect snowstorms of the Great Salt Lake. Monthly Weather Review, 128, 709–727.

USGS, 2022: Great Salt Lake, Utah. https://pubs.usgs.gov/wri/wri994189/PDF/WRI99-4189.pdf. Downloaded 3 Aug 2022.

USGS, 2022: Water Quality Samples for the Nation, USGS 10010000 Great Salt Lake near Saline,


Yeager, K. N., W. J. Steenburgh, and T. I. Alcott, 2013: Contributions of lake-effect periods to the
cool-season hydroclimate of the Great Salt Lake Basin. Journal of Applied Meteorology and
Climatology, 52, 341–362.

Wednesday, November 9, 2022

The White Wave Wins!

So much talk about a red or blue wave last night, when it was really a great white wave that won.  The numbers from Alta are very impressive and means a climatologically deep early season snowpack will control upper elevations of the central Wasatch for the next few weeks.

Let's talk some numbers.  The storm-total SWE and snowfall at Alta-Collins (so far) are 3.38" and 24" respectively.  The 24-hour and 12-hour SWE for the period ending at 6 AM this morning was 3.06" and the 12-h total for the period ending at 6 AM were 3.06" and 1.99".  These are big water totals at the upper ends of what happens at Alta during the winter.  

Observations from the last 24 hours also show a peak hourly SWE of 0.40" (I consider anything above 0.30" to be exceptionally heavy snowfall), which was accompanied by a 4" increase in snow depth on the interval board, and .86" in 3 hours.  

Source: MesoWest

This snow was mostly high-density base builder.  The mean water content of the storm so far is about 15%.  Temperatures did not decline below 29˚F at Alta-Collins until after 3 AM, so I suspect nearly the entire period featured Cascade Concrete.  

Total snow depth at Alta Collins is currently 56".  This is probably the 2nd most on this date in at least 30 years.  On November 9, 2004, the snow depth at Alta Collins was 59".  That year was the best early snowpack since 1990 at the Snowbird SNOTEL site (more on this below).  

It's harder to tell how the low and mid elevations fared.  Yesterday's cold front stalled between Salt Lake and Park City.  Some of the cold air bled into the Cottonwoods for a while yesterday to help keep snow levels lower than I expected, but on the Park City side it remained warm.  For example, at the Powerhouse observing site in lower Little Cottonwood Canyon (6049 ft), temperatures dropped to 32˚F early yesterday morning with the passage of the front and onset of precipitation, but slowly climbed through 1 AM this morning.  I suspect this site saw rain or mixed rain and snow yesterday afternoon through 1 AM, but a change over to snow this morning.  

Source: MesoWest

In contrast, the yesterday's cold front never made it to Park City.  Thus, temperatures at the UDOT SR-224 observing site, which at 6697 feet is several hundred feet higher than the Powerhouse site in Little Cottonwood, were near or above 38˚F for most of yesterday and last night, only dropping to 32˚F after about 3 AM this morning.  

Source: MesoWest

Thus, I suspect this was mainly a rain event below about 8000 feet on the Wasatch Back, although the totals at upper elevations even on the Park City Ridgeline should be pretty solid.  

Finally, we have the SNOTEL data from Snowbird.  As of midnight last night, the snowpack water equivalent was 9 inches.  This is the 2nd highest since 1990, behind only November 9, 2004 when it was 12.1 inches.  

Source: NRCS

The bottom line is that no matter how the election count turns out, we remain a deeply divided country.  However, the white wave has taken over the central Wasatch and we have the 2nd best early season snowpack since 1990.  So, regardless of where you fall on the political spectrum, there are good reasons to celebrate.  What an amazing start to the ski season!

Tuesday, November 8, 2022

Early November Storm of Our Dreams

Mother Nature is serving appetizers this morning before the main course tonight and tomorrow in the form that I can only describe as an Early November Storm of Our Dreams.  

The surface cold front moved into the Salt Lake Valley last night, passing over the University of Utah at about 0530 MST this morning and producing a rapid drop in temperature.  Temperatures have subsequently fallen into the high 30s.  

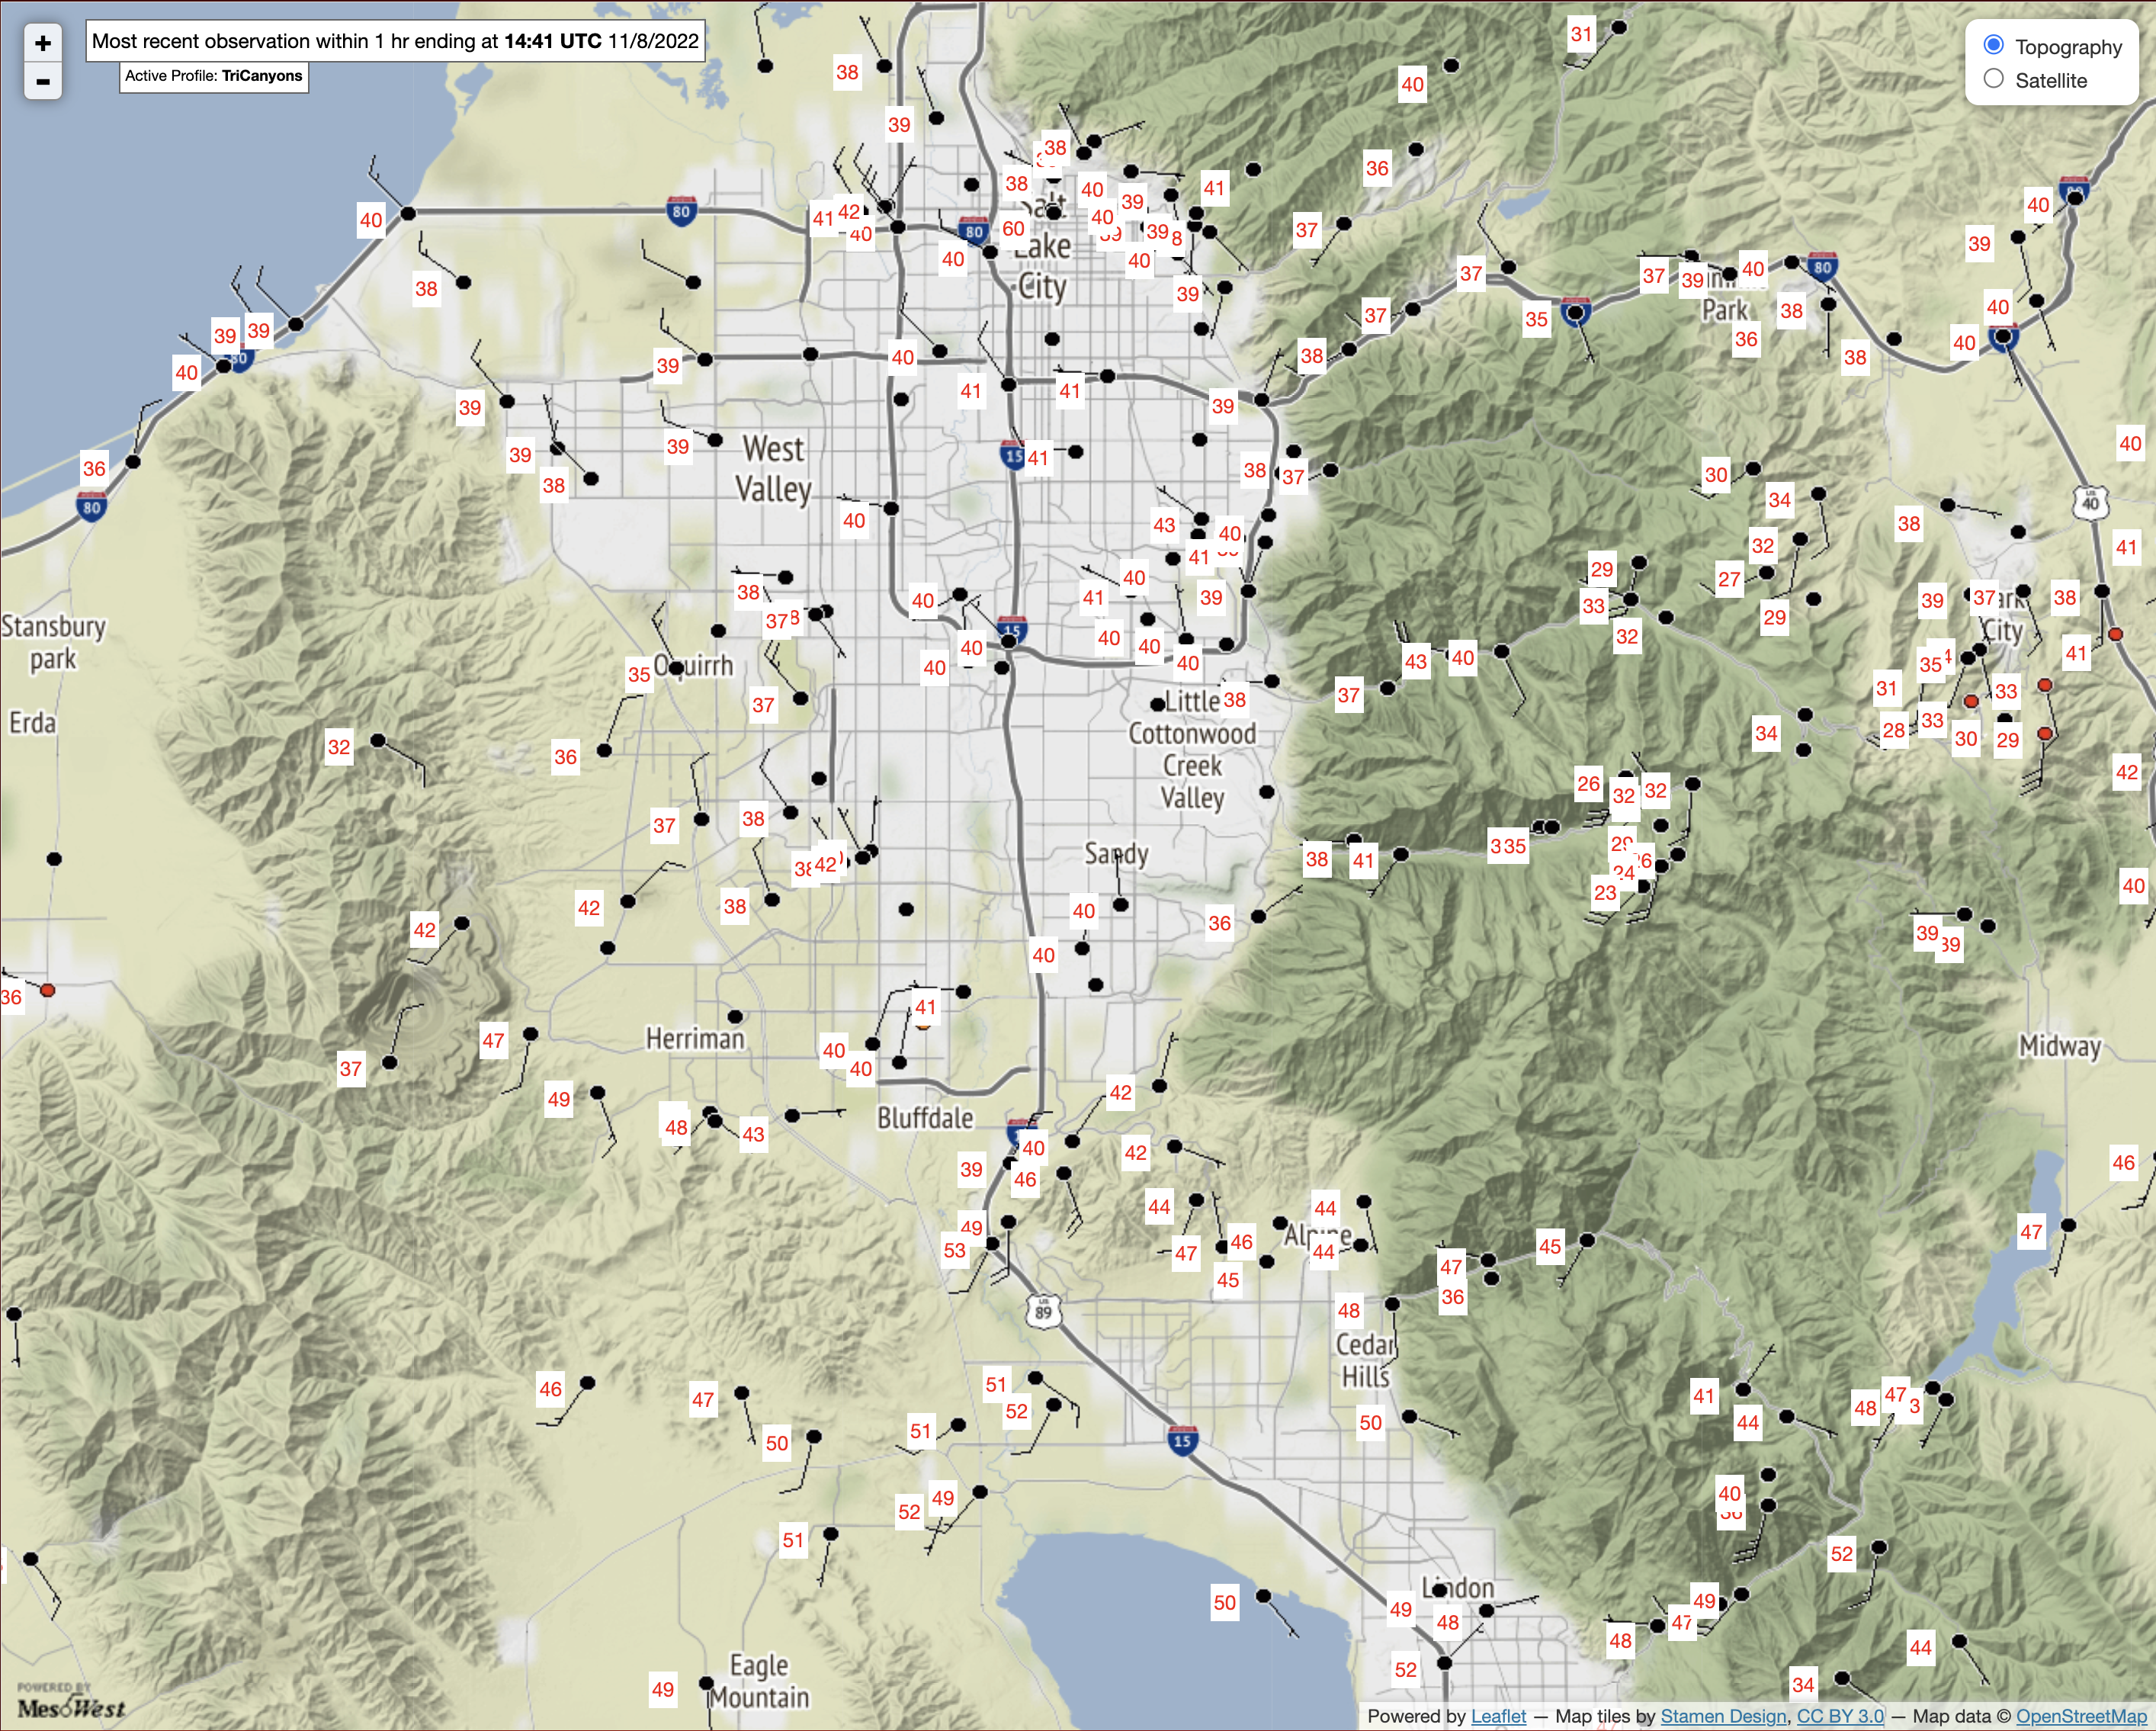
As of 1441 UTC (0741 MST) this morning the front was very near Point of the Mountain with north winds and temps near 40 in Bluffdale and Draper, but southerly flow and temps near 50 around Point of the Mountain and Saratoga Springs.  Crest-level winds in the central Wasatch remain southerly or southwesterly on Hidden Peak, Mt. Baldy, Cardiff Peak, and Reynolds Peak.  The front has not arrived in the central Wasatch, so snow levels remain high.  It is 32–35˚F at observing sites near the base of Alta for example. 


Radar imagery at 1440 UTC (0740 MST) shows scattered precipitation, in some areas heavy (e.g., southeast Salt Lake Valley and western Central Wasatch. 


Nearly all of these precipitation features are moving from southwest to northeast as the cold-front is shallow and the primary driver of precipitation processes remains the southwesterly flow aloft.  

Observations from Alta-Collins shows fits and starts of precipitation overnight, increasing in intensity after about 0500 MST.  In the hour ending at 0700 MST, 0.17" of water equivalent fell, and a total of 0.32" has fallen since midnight.  Temperatures at this 9662 ft observing site are mild and are now around 29˚F.  


We recently installed a profiling radar system at the Atwater site near the base of Alta.  This is a radar that looks up through the storm, rather than scanning horizontally. Overnight, Echoes were first detected aloft at 0400 UTC (2100 MST) and reached the ground at about 0600 UTC (2300 MST).  The pulse-like nature of the echoes through 1430 UTC (0730 MST) is consistent with convective showers, which were probably in the form of wet snow and graupel at the observing site and even to upper elevations.  


The forecast for today is essentially a WYSIWYG forecast, meaning What You See Is What You Get.  The 12Z HRRR for example, stalls the front pretty much near it's current location near Point of the Mountain with northerly flow over the Salt Lake Valley at 2200 UTC (1500 MST), southerly flow near Point of the Mountain, and southerly to south-southwesterly flow over the Central Wasatch.  

The HRRR also produces periods of showers in the southwesterly upper level flow, sometimes heavy, in the form of upper elevation snow and lower elevation rain through the day today.  The other models are in general agreement with this.  If you are skiing today, hard shell recommended as the snow level will be in the 7000-8000 ft range and above that the snow will be wet.  Note that thunder and lightning are possible with stronger showers.  

Things change overnight.  I added time-height sections for the HRRR to weather.utah.edu yesterday [under the HRRR (48 h) tab] so I'll used it here to illustrate what is expected.  Overnight, a deeper cold front pushes into the Salt Lake Valley at around 0800 UTC (0100 MST).  Ahead of this front, the southerlies intensify so we will see return to southerly flow in the Salt Lake Valley.  Additionally, this isn't one of those northwesterly cold surges.  The flow behind the front shifts briefly only slightly and the flow aloft gradually veers from southerly to westerly over a several hour period.  


However, the models are generally locked in on the front being accompanied by heavy precipitation.  The have actually been advertising this for days, although amounts have been variable.  The HRRR composite reflectivity and satellite imagery forecast for the time of frontal passage [0800 UTC (0100 MST) tonight] shows the band of heavy precipitation extending from St. George to Salt Lake City.  

Precipitation continues overnight in the wake of the front. Although there could be a break during the day tomorrow, convective showers develop in the deep cold air that moves in tomorrow afternoon.  


Let's look at some numbers.  From 1200 UTC (0500 MST) this morning (Tuesday) through 1200 UTC (0500 MST) Thursday, the HRRR generates 2.09" of water equivalent at Alta-Collins. Given the southwesterly flow, it's even more excited for Sundance, Snowbasin, and Powder Mountain, although those resorts will probably see rain at their bases today.  Most of this falls through mid-morning tomorrow (Wednesday).

The GFS numbers are pretty similar.  The GFS totals below, however, include precipitation overnight, but at least for Alta-Collins the GFS didn't produce any precipitation overnight, so from 1200 UTC (0500 MST) this morning (Tuesday) through 1200 UTC (0500 MST) Thursday, the GFS is generating 2.4" at that site. 
Our GFS-derived guidance product shows very well the situation today with a high wet-bulb zero level (and snow level) today that crashes down overnight when the front moves in.  Snow-to-liquid ratios are near 10:1 today but increase to 15"1 overnight.  I suspect the former is too high and we will see even higher densities than that. 

 
The 2.46" of water equates to 26.1" of snow based on our algorithms.  Most of this falls by 10 am tomorrow with dribs and drabs after that.  The increase in snow-to-liquid ratio during the storm indicates that although the average density will be high, it will be a right-side-up storm, although avy danger is likely to be an issue.  

My take on this is we are probably going to see storm totals at Alta Collins from last night through Thursday morning in the 2-3" range for water equivalent and 20–30" for snowfall.  The lower elevations will suffer today, but get a decent shot once the front comes in tonight.  The NWS is even more excited, going for 2.5–3.5" of water (although their 18–32" of snow brackets my 20–30").  

NWS Cottonwood Canyons Forecast screenshot at 8:32 AM 8 November 2022

What can I say?  This is a dream early November storm for building a seasonal snowpack.  

Monday, November 7, 2022

Buckle Up

 Red sky at morning sailors take warning?


Actually, the sky looked sort of purple today, as if I woke up in Mordor.  I knew something was up when I woke in the night and the house was shaking.  Indeed it was an impressively windy night in the lowlands with several sites reporting gusts of 60 mph or more including 68 mph near Point of the Mountain and 65 at the intersection of I-80 and SR-201 in the Salt Lake Valley.  

The instigator of this big blow is a deep upper-level trough that is amplifying off the Pacific coast.  The interaction of this feature with the Sierra Nevada is resulting in the development of low pressure over the Great Basin and a strong pressure gradient over western Utah.  

I'm a little surprised it blew so hard last night based solely on the large-scale analyses, suggesting something else is happening, but my time is limited for proper sleuthing and I'm more interested in the potential for snow.  

The upper-level trough note above, along with surface features that develop over the Great Basin as that trough digs off the west coast and eventually moves eastward, will dominate our weather over the next few days.  

Today in the Salt Lake Valley it will be dry, warm, and windy.  In the central Wasatch, there could be a few angry fits and starts of snow, but if it happens, it will only be enough to lacerate your face.  

A sharp surface trough and frontal boundary will develop just to our north (annotated on the upper-right hand image below).  This is a common occurrence as an upper-level trough digs off the west coast.  By 0600 UTC 8 Nov (11 PM MST Monday), the frontal boundary is just to our north, which is why we are likely to remain dry despite the fact that weak atmospheric river conditions extend over our area (lower right). 

On Monday night and Tuesday morning, that frontal boundary sags southward and at 1800 UTC 8 November (11 AM Tuesday) it's located very near the Salt Lake City International Airport.  

It's such a close call that I'm not sure if the front and it's precipitation will make it into the Salt Lake Valley and the central Wasatch.  Right now the GFS is bringing it right to the Salt Lake City International Airport.  Below is a closeup at 1800 UTC 8 November (11 AM Tuesday) and the wind shift is perhaps just north of the airport with light precipitation extending eastward to the central Wasatch.  


Right now, this is a chance of valley showers, mountain snow showers situation for tomorrow, with snow levels near or around 7000 to 7500 feet.  We'll potentially get skunked if the front stays a bit north, or do better if it pushes a bit farther south.  

Things begin to light up, however, as the upper-level trough and associated surface low move inland.  Rain moves into northern Utah Tuesday night and by 1200 UTC 9 November (5 AM Wednesday) a band of heavy precipitation covers most of western and northern Utah.  


For that storm period, the GFS has been bouncing around the past several runs between 2 and 4 inches of snow water equivalent for Alta.  In the latest run from last night, it's putting out about 0.3" with the cold front on Tuesday and then about 1.45" with the main band on Tuesday night and Wednesday, followed by some more dribs and drabs Wednesday night.  


A glance at the Euro suggests it's a bit wetter.  For the entire period, the downscaled NAEFS is putting out an average of about 2.75 inches of water.  All but two members are above 1.5 inches.  


The bottom line is that this will be another major storm adding 1.5 inches of water or more to our upper-elevation snowpack in Little Cottonwood.  Perhaps we will take a closer look tomorrow if I can find the time.