
Questions about the representativeness of the KSLC observing site notwithstanding, below are the new records for Salt Lake City based on official records from the National Weather Service. Figures are from https://xmacis.rcc-acis.org/.
1. Highest average maximum temperature, 94.1˚F.

2. Highest average minimum temperature, 68.8˚F.

3. Highest average temperature, 81.5˚F.


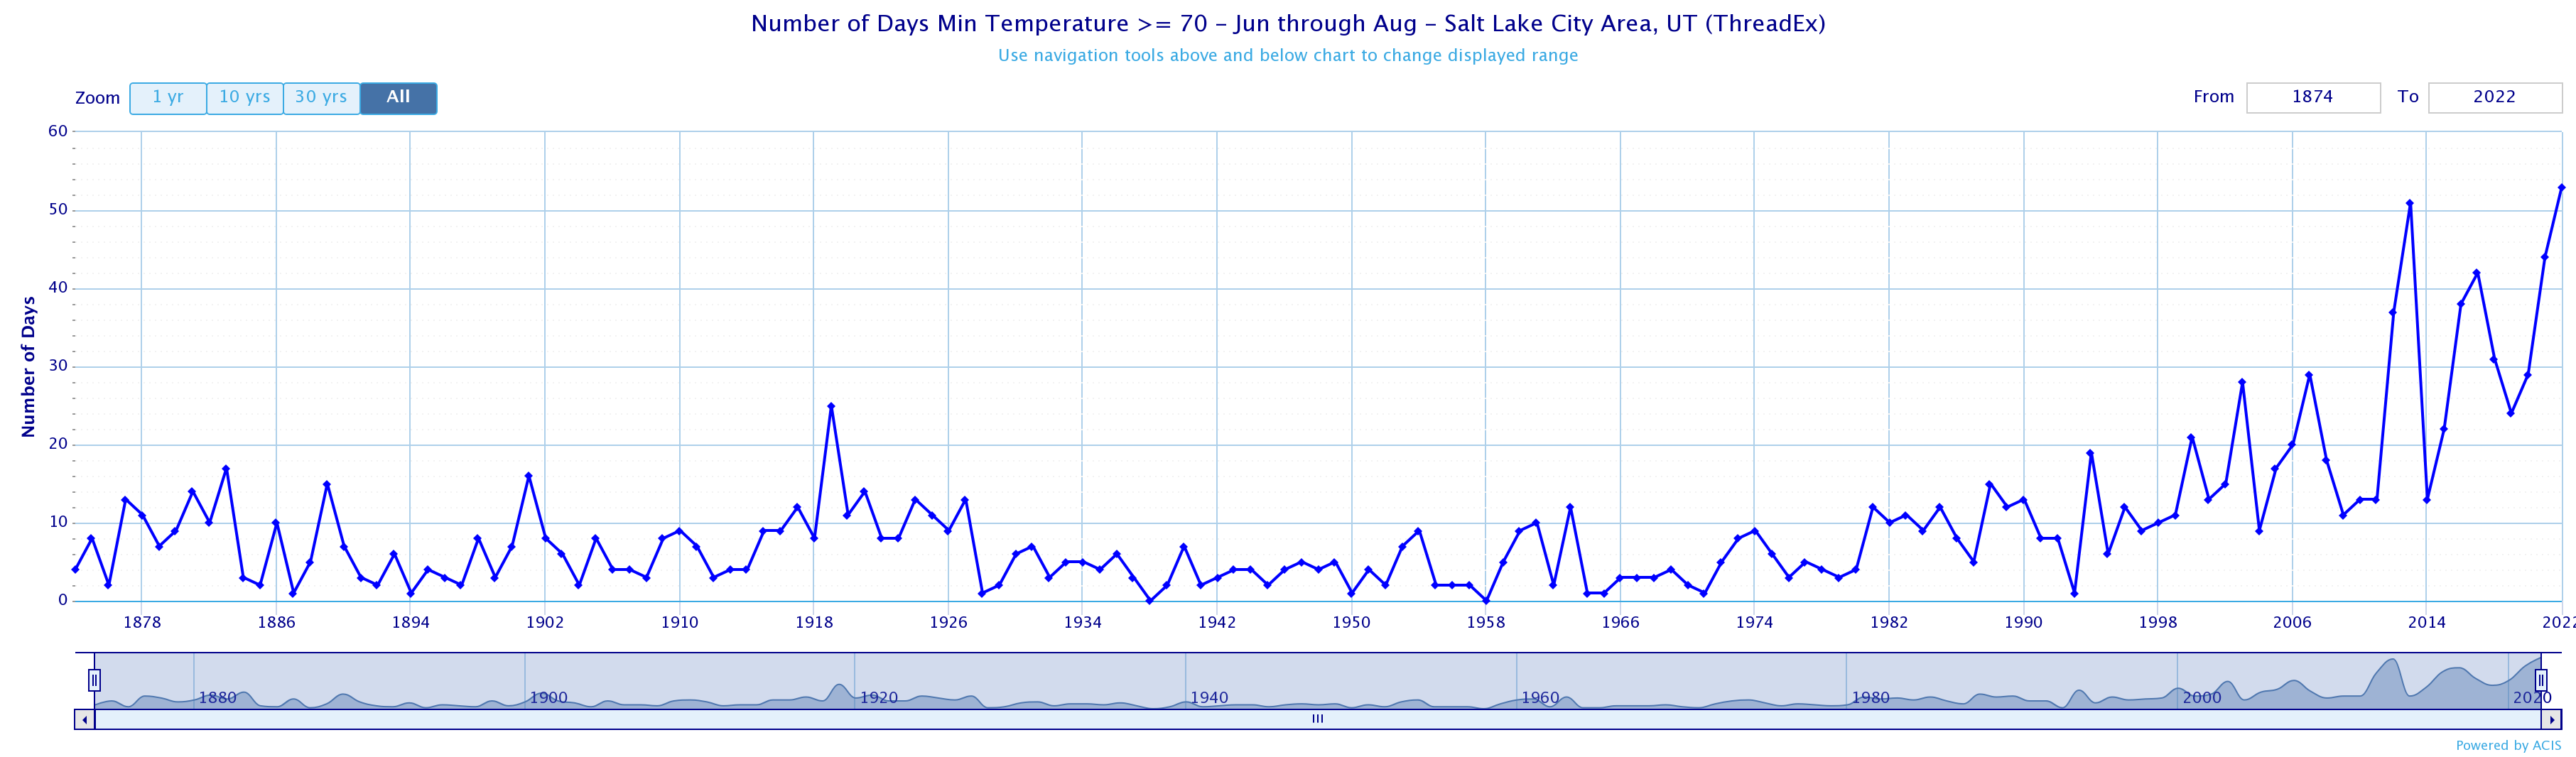
5. Days with a minimum temperature ≥ 70˚F, 53.
In an earlier post (A Look at Max Temps @KSLC) we took a look at temperatures at the observing site compared to site on the Bountiful Bench. At that site, records go back to 1975 and this summer's mean maximum temperature was the 5th highest (86.5˚F, the record is 87.7˚F in 2007), the mean temperature was the third highest (76.0˚F, the record is 76.4˚F in 2021), and the mean minimum temperature was the second highest (65.5˚F, the record is 65.5˚F in 2021). Let's also look at the top 5s for each of these variables at this site. Records go back to 1975 and they are complete (i.e., no missing days).
Minimum Temperature:
2021: 66.0
2022: 65.5
2003: 65.4
2007: 65.0
2012: 64.8
Mean Temperature:
2021: 76.4
2007: 76.3
2022: 76.0
1994: 75.8
2003: 75.7
Maximum Temperature:
2007: 87.7
2006: 87.7
1994: 87.5
2021: 86.8
2022: 86.5
The evidence is quite strong that we are in a different climate today along the Wasatch Front than the one that existed during the 20th century. In recent years we are seeing higher temperatures, especially minimum temperatures. These data above shows this is happening on the valley floor and on the benches.
More sleuthing is needed to evaluate the impact of station moves and land-surface conditions on trends at KSLC. Ultimately, this won't change the story much. We are living in a warming world and a warming urban area. The summer climate of the 20th century is gone forever. Fluctuations from summer to summer are occurring around a higher and climbing mean.
I am still very interested in GSL lake level and surface area. The loss of the lakes allows more land mass to absorb heat, less cooling from the water holding temps lower, less cooling of the air mass as it now travels over the land vs. water. And now far far more roofs, road ways, black top all absorbing heat. I agree 100% the climate is warmer here in the valley, and everywhere else in the world . . . but I think the decreased GSL surface area and the loss of undeveloped land to heat absorbing surfaces is making it hotter in the Valley.
ReplyDeleteThere is also an effect of increasing evapotranspiration from both natural forest and lawns, trees and other planted landscapes.
ReplyDeleteI believe there is a possibility this will significantly and adversely affect water supply through both decreasing supply and increasing demand.
The models used to predict ground water recharge use historical temperature datasets that will not necessarily reflect our current and future conditions, unless they are adjusted to match probable conditions.
Whelp this speeds up my get the F out of Wasatch front timeline by at least 5 years......
ReplyDelete