Wednesday, October 31, 2012

Eastern Snow

Snow in the central and southern Appalachians is beginning to wind down as the remnants of the SuperFrankenStorm lift northward.

Some nice photos from the LeConte Lodge, which is located at 6,593 feet in Great Smoky Mountains National Park and accessible only by trail, are available here and here.  They report 34" of snow.

Source: http://www.highonleconte.com
More than 20 inches of snow fell at some locations during the 24-hour period ending at midnight last night.  Snow depths on the ground across a wide portion of the mountains of West Virginia exceed 20 inches in the latest analyses from the National Operational Hydrologic Remote Sensing Center.

Source: NOHRSC
As of Tuesday afternoon, 19" had fallen at Snowshoe Mountain Resort, and it looks like it was the really thick, creamy stuff.

Source: http://myfox8.com
This could be their deepest natural snowpack of the entire winter.  A real risk now will be flooding if they get a warm spell with rain.

Update @ 8:33 AM:

Just came across this photo from Davis, WV.  Sweet! Source unknown.

Source: Beau Dodson

Tuesday, October 30, 2012

Timing Is Everything

Unfortunately, it was a worst-case scenario in upper and lower New York Bay last night with regards to storm surge.  As can be seen in the time trace of water levels at The Battery, the peak storm surge (indicated by green line) coincided with high tide, yielding an all time record water level of 13.88 ft above mean lower low water (roughly mean low tide) at 9:24 PM EDT, greatly eclipsing the former record, which is reported to be 10.5 feet during Hurricane Donna in 1960.

Source: National Data Buoy Center
Contributing to this surge was a veering of the wind during and following the landfall of the low center over southern New Jersey.  The time series below, which ends at 900 PM EDT, shows how the wind veered from NNE to ESE at Newark Airport in the five hours preceding peak water levels.

Source: MesoWest
The surface plot for 900 PM EDT shows strong ESE to SE flow streaming toward the New York Bight and adjoining bays and waterways of northern New Jersey and NYC.


SuperFrankenStorm Sandy was an exceptional event, made all the more exceptional by unfortunate timing.  We can only hope now that the recovery effort goes as quickly and smoothly as possible.

Monday, October 29, 2012

Meanwhile, in West Virginia

Source: http://canaanresort.com
Source: NWS


Sandy Approaching Jersey Shore

Sea level pressure at Atlantic City is now below 960 mb and still dropping like a rock (see middle frame below) as the low center approaches.  Note the dramatic warming (blue trace, middle frame) which is indicative of the system's warm core.  Water levels are now on the increase with high tide approaching.

Source: NDBC
The influence of the storm surge is clearly evident in at The Battery.  It appears we will exceed the peak water levels that were obtained this morning and unfortunately see a peak near or above the record of 10.5 feet.

Source: NDBC
La Guardia airport is now reporting wind gusts to 60 miles per hour, with sustained winds of over 45 miles per hour.


I wonder how hard it is blowing on the top of skyscrapers and near the top of the Freedom Tower.  There is very strong vertical wind shear over the area, with the flow aloft much stronger than that observed at the surface.


A Sandy Update


Sandy is now off the Jersey shore, as indicated above.  Amongst the amazing observations is a the rapid increase in significant wave height to more than 30 feet at buoy 4408, which is located about 200 km east of Long Island.  

Source: National Data Buoy Center
The Battery in NYC peaked at about 9 feet above Mean Lower Low Water (MLLW) during the morning high tide, but the next high tide is expected to be worse.

Source: NOAA/NWS/MDL
Jeff Master's Blog suggests that the peak during Hurricane Irene last year was 9.5 feet and that the record is 10.5 feet.  Thus, the next several hours are the most critical with regards to the storm surge.  Let's hope the forecast is overdone.

A Remarkable Forecast

It remains to be seen how good and useful forecasts of Sandy and her impacts will be as she comes ashore, but for anyone who is old enough to recall how difficult it was during the youthful days of numerical weather prediction to even predict the formation of an east coast cyclone, let alone the track in a complex situation like this one, the forecasts thus far have been quite remarkable.

Imagine if you will a situation where we have all of today's forecast tools, including satellites, but no numerical weather prediction systems produce a forecast.  My guess is that very few people would have anticipated several days in advance that Sandy would make a quick left turn and head to New Jersey, as she is presently doing.

Note in particular in the loop below the amplification of the upper-level ridge south of Greenland, which is playing a critical role in steering Sandy to the west.  Such an amplification, which is likely related to a predecessor cyclogenesis event over central Canada (see early in the loop) and strong heating within a precipitation region that extends over the eastern US and Canada, would be very difficult to anticipate without numerical model guidance.

 
As we discussed on Saturday, there was some uncertainty several days ago with regards to the specifics of Sandy's track, especially where she would make landfall, but with a lead time of a few days, the left hand bend was anticipated by most ensemble members.  

Time will tell if the details of the forecast during landfall will prove good and useful.  As a meteorologist, you want to see your profession do well, but admittedly, it would be better if Sandy proves less damaging than advertised.

Sunday, October 28, 2012

Mountains, Snow, and the Frankenstorm

Hurricane Sandy, a.k.a. The Frankenstorm, remains a serious threat to the eastern United States.  I'm going to leave the wind, flood, and surge discussion to others (official forecasts at weather.gov) and instead talk in this post about some interesting and likely influences of topography on the event.

Current forecast models have Sandy making landfall somewhere between the Delmarva Peninsula and New York City.  For example, the NAM initialized this morning (1200 UTC 28 Oct) has Sandy making landfall in central New Jersey.

1200 UTC 28 Oct 2012 initialized NAM forecast of 12-h accumulated
precipitation (inches color filled), 925 mb streamlines, and 850-mb
0ºC isotherm (red) valid 0000 UTC 30 Oct 2012.
During landfall, precipitation is heaviest over the mid-Atlantic states.  To the north, where the flow at 925 mb (roughly mid-mountain level for the higher eastern ranges) is southeasterly to northeasterly, one can clearly see the influence of the terrain on precipitation, which is heaviest over the White Mountains of New Hampshire and hills of central Massachusetts, Green Mountains of Vermont and Berkshires of Massachusetts, and Catskill Mountains of southeastern New York.  Less precipitation falls over the intervening Connecticut River and Hudson River Valleys.

The influence of these ranges continues as Sandy moves inland and the flow over the region transitions to southeasterly, with the Adirondacks also getting in on the action.

1200 UTC 28 Oct 2012 initialized NAM forecast of 12-h accumulated
precipitation (inches color filled), 925 mb streamlines, and 850-mb
0ºC isotherm (red) valid 1200 UTC 30 Oct 2012.
Note how the more inland mountain ranges (following the flow) receive less precipitaiton.  I suspect this is a reflection of airmass transformation, the drying of the airmass as precipitation falls out over upstream barriers.  One can also see some changes in the location of heaviest precipitation, which is partly related to the position of the large-scale precipitation shield, as well as changes in the direction of the flow and it's orientation relative to the terrain.

But for skiers the real interesting orographic effects happen in West Virginia.  During the period encapsulated by the images above, the mountains of West Virginia are in moist northwesterly flow and experience strong upslope.  In addition, Sandy taps into colder air that is presently in place over the midwest.  The red line in the images above shows the 0ºC isotherm at 850 mb (about 5000 ft) and you can see the tongue of cold air that wraps across West Virginia and around Sandy.

Thus, the upper-elevaitons of the mountains of West Virginia are expected to experience heavy snowfall during this period.  Check out this morning's National Weather Service forecast for Snowshoe.

Source: NWS
While Sandy could bring skier's delight to the mountains of West Virginia (at least for those willing to earn their turns), I don't wish to trivialize the storm in any way, shape, or form.  The forecast from the National Hurricane Center is quite clear:

"SANDY EXPECTED TO BRING LIFE-THREATENING STORM SURGE FLOODING TO THE MID-ATLANTIC COAST...INCLUDING LONG ISLAND SOUND AND NEW YORK HARBOR... ...WINDS EXPECTED TO BE NEAR HURRICANE FORCE AT LANDFALL"

In addition, the storm is broad in scale and will have impacts across much of the mid-Atlantic and Northeast United States.  Effects will vary, however, depending on location.  This is a complicated storm.  Stay tuned to forecasts and heed warnings if you live in areas that will be affected by the storm.

Saturday, October 27, 2012

Predicting Frankenstorm's Track

Source: http://www.barefootbenny.com
By now you've heard of the Frankenstorm, the unoffical name given for Hurricane Sandy as it moves northward, undergoes extratropical transition (i.e., the conversion from a tropical to midlatitude cyclone), and impacts eastern United States.

For a few days now it has been clear that Sandy would evolve into an exceptional cyclone as it moved into the mid latitudes.  The track forecast has proven more difficult.

Below are track forecasts produced by the NCEP Global Ensemble Forecast System over the past four days.  Note the wide range of possible tracks in the older forecasts (top figures), including some that took Sandy eastward and well away from the US.  Over time, with decreasing forecast lead time, the GEFS ensemble converges toward a solution where Sandy curves westward and makes landfall somewhere between Maryland and southern New England.  

Forecasts initialized 0000 UTC 24 Oct.
Source: NOAA/ESRL
Forecasts initialized 0000 UTC 25 Oct.
Source: NOAA/ESRL
Forecasts initialized 0000 UTC 26 Oct.
Source: NOAA/ESRL 
Forecasts initialized 0000 UTC 27 Oct.
Source: NOAA/ESRL
This is just one ensemble modeling system, and there are others that meteorologists consult to attempt to get their arms around the possibilities.  The European Center ensemble forecasts show the largest number of tracks making landfall between Maryland and New York, but there are outliers, including one that goes eastward away from the US.

Forecasts initialized 0000 UTC 27 Oct.
Source: NOAA ESRL
The official forecast issued by the National Hurricane Center in part reflects these ensembles.  The white cone in their forecast below illustrates the area of the probable path of the storm (more info here).  It extends from Virginia Beach to New York City.


Ensembles are playing a critical role in forecasts for the Frankenstorm.  They help to illustrate the most likely areas of landfall, but they also tell us that we can't precisely nail down the track and location of landfall at that time.  That being said, this is a very broad storm and impacts will be widespread.  Stay tuned to official forecasts at weather.gov.  

Friday, October 26, 2012

The Afternoon Demise of Lake Effect

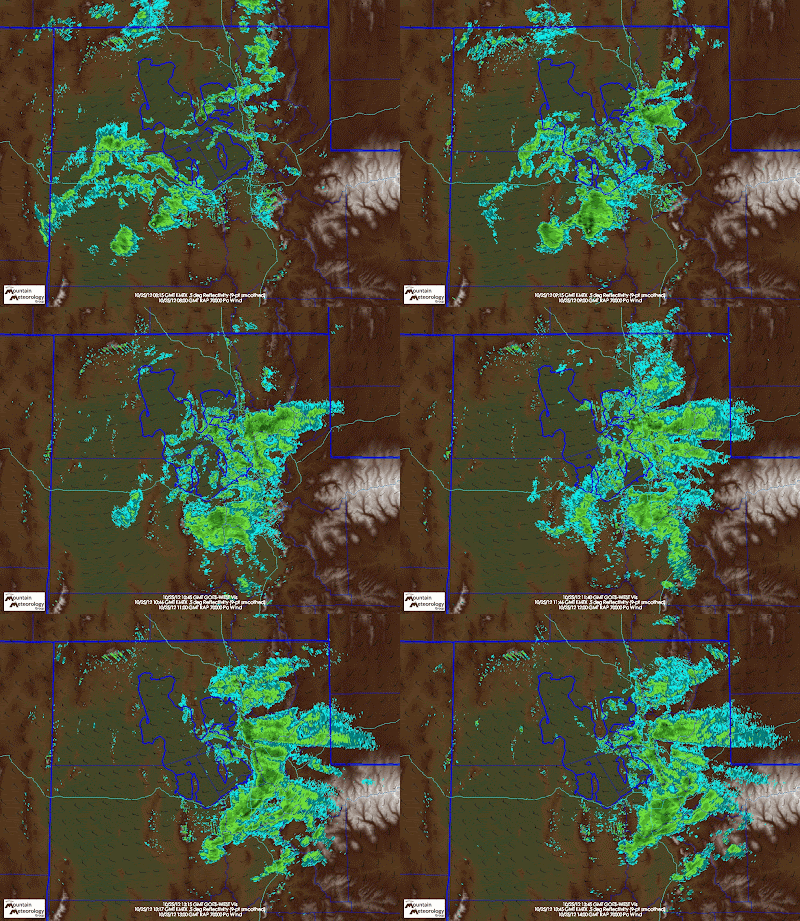
Like a vampire, the Great Salt Lake Effect does not like the sun.  Yesterday's event provided a marvelous example of how lake effect tends to weaken during the day.  Note in the loop below how the lake effect is well organized during the morning, but falls apart and is replaced by scattered snow showers that form all over northern Utah during the afternoon.


Just to drive that point home, the images below show the transition from coherent, organized lake effect in the morning [1600 UTC (10 AM MDT)] to scattered snow showers in the afternoon [2100 UTC (3 PM MDT)].


This daily modulation shows up very well in the Great Salt Lake effect climatology.  As shown by Alcott et al. (2012), the Great Salt Lake effect is far more common from sunset to just after sunrise than it is during the afternoon.  This effect is strongest during the spring, when the days are long and the sun angle high, than during the winter, when the days are short and the sun angle low.

Source: Alcott et al. (2012)
In addition, Great Salt Lake effect events are more likely to start at night and end during the day.

Source: Alcott et al. (2012)
To understand this daily modulation, you need to abandon the conventional wisdom that lake effect is caused simply by the atmosphere picking up water vapor over the Great Salt Lake.  That can be a contributing factor, but it is the heating of the atmosphere when cold air moves over the relatively warm Great Salt Lake that is critical for lake effect.  This heating has two effects.  First, it destabilizes the atmosphere.  Second, it induces a pressure trough, which contributes to the development of offshore flow and low-level convergence over the Great Salt Lake.  This thermally driven convergence helps to initiate and organize lake-effect snow showers.

Source: The COMET Program
During the day, however, the air is not only warmed over the Great Salt Lake, but also by heating over the surrounding land surface.  This destabilizes the atmosphere over the land and weakens the temperature contrast between the lake and the land.  As a result, the thermally driven convergence weakens.  Sometimes the air over the land becomes warmer than over the lake, and the low level flow over the lake diverges, which is especially bad news for lake effect.  

Therefore, daytime heating frequently results in a transition from lake-effect precipitation, which falls primarily over and downstream of the Great Salt Lake, to scattered snow showers, which fall all over northern Utah.  While lake effect can sit in one place and produce a significant accumulation, scattered snow showers typically move around a lot and don't yield large accumulations.  Because of the influence of day length and sun angle, this daily modulation of lake-effect is typically strongest in the spring and weakest in the winter (lake effect is rare in the summer).  

Of course, there are exceptions.  There are some lake-effect events that do start or rage on during the afternoon.  An example is the lake-effect band of November 25, 2001, which contributed to the "Hundred Inch Storm" and was fully developed at 2340 UTC (440 PM MST).


However, this was an event with widespread snow cover that occurred within a month of the winter solstice, which likely led to minimal daytime surface heating over land.  

The bottom line is that the Great Salt Lake effect is a nocturnal creature, that only under the right conditions does it make an appearance in the afternoon. 

Thursday, October 25, 2012

Morning Lake Effect

Lake-effect developed around 9 am this morning.


Playing a critical role in the initiation of the event is a convergence zone that separates strong westerly flow over the western Great Salt Lake from weak or easterly flow over Antelope Island and the northern Wasatch Front. This convergence zone shows up very well in the surface plot below and extends from just southwest of Promontory Point into the Salt Lake Valley.  


I'm still thinking the lake effect will weaken and become more widely scattered with time (see previous post), but if I'm wrong, I won't complain.

Head North

The northern mountains continue to be the big winners in this storm.  Another 1.43 inches of SWE fell in the past 24 hours at Snowbasin-Middle Bowl, bringing their storm total to just over 3.5 inches.  It looks downright wintery on the Needles Lodge web cam.

Source: Snowbasin
The snow depth at the Ben Lomond Peak SNOTEL hit 18 inches this morning, not bad considering the early snowfall has probably settled out some.  The Monte Cristo SNOTEL is down to 28", but again, given the ongoing settlement, that's a pretty healthy number.  I suspect the early season turns are quite good in the upper elevations of the northern Wasatch and Powder Mountain area, especially at or above 8000 feet.

Snowfall in the Cottonwoods has been more limited, but they did pick up some this morning.  Alta-Collins had a 8" snowdepth at 8 am MDT, roughly consistent with the Snowbird web cam.

Source: Snowbird
We have about a 12-hour window left for snow, but much depends on that great wildcard – the Great Salt Lake.  The loop below (click to enlarge), shows snow showers moving through the Wasatch Front this morning along with a 700-mb trough.


For the most part, those snow showers were not generated by the Great Salt Lake, but were simply associated with the 700-mb trough that was moving across northern Utah.  We'll see some additional scattered snowshowers today, but for big accumulations, we probably need lake effect to get going.  Unfortunately, it is tough for lake effect to rage during the day.  There are a few instances where it has happened, but usually lake effect is strongest at night and during the early morning.  Thus, although I think we'll see some lake-effect snow showers, I don't see us getting a hammering in the Cottonwoods and suspect those of you who want decent turns this weekend will need to head north.

Wednesday, October 24, 2012

Where to Go for Snow

The Ogden-area mountains remain the big winners from this latest storm cycle.  Snow depth at the Ben Lomond SNOTEL (8000 ft) peaked at 15 inches this morning.


The storm-total snow-water equivalent was about 2.2 inches.

As of yesterday afternoon @ 2 pm, Snowbasin reported 12 inches at their Middle Bowl observing site.  Accumulations might be greater at higher altitudes where the precipitation likely changed to snow earlier in the storm.

If it can be trusted, the Monte Cristo SNOTEL reports a snow depth of 30 inches!  Perhaps it higher altitude (almost 9000 ft) enabled some of the precipitation early in the storm to fall as snow.  Storm-total SWE was 2.9 inches.


Wondering where Monte Christo is?  It's along UT-39 between Huntsville and Woodruff.


UT-39 usually closed during the winter, but UDOT presently lists it as open until Nov 3.  There's not much good ski terrain up there, and you have to go down from the SNOTEL to altitudes that likely received less snow, but hmmm.....

Thus far accumulations are limited in the central Wasatch, although it is refreshing to occasionally spy white mountains through the clouds.

Tuesday, October 23, 2012

Location, Location, Location

With a narrow band of precipitation over northern Utah, it was all about location, location, location last night.  There was a remarkable contrast between the southern Wasatch Front, which got very little precipitation, and the northern Wasatch Front, which got pounded.  This shows up well in the radar loop below.


It is also apparent when looking at the radar-derived and gauge-measured storm-total precipitation analyses, which show nearly 2 inches of total precipitation in the Ogden-area mountains, but less than a half inch in the Cottonwoods.


I might add it was also colder to the north overnight.  Even at 0800 MDT this morning, it was 21ºF at Powder Mountain (8897 ft) compared with 30ºF at Alta-Collins (9662 ft).  The net result is that overnight the Cottonwoods saw very little snow, whereas the goods fell in the mountains to the north, as illustrated by the morning web cams.

Source: alta.com
Source: Powder Mountain
As we discussed yesterday, the Short-Range Ensemble Forecast (SREF) system hinted at the possibility that the Cottonwoods might be just south of the action overnight.  This was a case where the SREF proved to be quite helpful, since it helped illustrate where the larger-scale precipitation band was likely to be located.  On the other hand, I suspect it still understimated precipitation totals in the Ogden-area mountains.  At 16-km grid spacing, it simply cannot pick up on the orographic enhancement that occurs in that area.

Monday, October 22, 2012

What a View!

12:54 PM MDT 22 Oct 2012
I love the orographic clouds that form over Lone Peak in southwesterly flow.  Check out the orographically forced cumulus and capping lenticular in the image above.  Gorgeous stuff!

Update @1:10 PM MDT:

And now there's dust in the Salt Lake Valley.  Oh Yeah!

Winter Begins, but the Forecast Is Tricky

Winter arrives in northern Utah this week.  Whether or not it is here to stay is debatable, but the next few days look quite active.  As I write this on Monday morning, the snow level is sitting around 9500 feet.  As impressive as the Dodge Ram appears in TV commercials, I think this guy ought to get his pickup off of Hidden Peak really fast.

Source: Snowbird.com
Although snow levels are currently high, they will be dropping tonight.  Through noon tomorrow, however, the short-term precipitation forecast is remarkably difficult.  For example, this morning's 1200 UTC NAM calls for only 0.31 inches of SWE to fall at Alta through tomorrow (Tuesday) at noon.  Contrast that to the 0600 UTC GFS, which is going berserk with 1.10" of SWE.  That is a huge differential, especially when one considers the poor terrain resolution of the GFS, which usually underpredicts mountain precipitation.  

Part of the reason for the difference is that we are right on the edge of the storm over the next 24 hours. As can be seen in forecasts produced by the Short Range Ensemble Forecast system, more than 90% of the members call for at least 0.25" of SWE to fall over extreme northern Utah, southeast Idaho and western Wyoming, but the fraction of forecast members that call for that much precipitation drops off rapidly as one moves southward.  The central Wasatch sit right in that dropoff area.  
Source: NOAA/NWS/NCEP/SPC
Through noon tomorrow, I'm inclined to lean toward the NAM, with periods of precipitation through noon tomorrow and accumulations of up to 6 inches in the upper elevations.  Those hoping for more can always hope that the GFS turns out to be the model of choice, or that the high terrain around the Cottonwoods lights up the southwesterly flow more than either model indicates (it happens, but not all the time).  

There's also the storms that will follow during the rest of the week.  Keep your fingers crossed.

Saturday, October 20, 2012

The Alta Avalanche Studies


To help stimulate your enthusiasm as ski season approaches, take a few moments to follow the footsteps of Alta's avalanche pioneers by reading The Avalanche Studies (available here as a 63 Mb pdf), which was written by Monty Atwater and Felix Koziol in 1949.  You won't be disappointed.

It summarizes the incredible early avalanche history of Alta, including the activities during the late 1930s and 1940s to tame the white death.  Here are some of the historical gold nuggets.

An early avalanche map of Alta, including current
and proposed facilities
Annotated avalanches photos that include some great
historical shots of early Alta ski area
Evidence that Mother Nature had as little sympathy for
cars then as she does today
Beautiful weather and avalanche charts that
became the template for what is done today
Discussions of avalanche control techniques
And then there is the text itself.  Many people believe that the snow at Alta is unusually dry, but this is simply not the case.  There are a number of reasons why the skiing is so good in the Wasatch, but it has more to do with the abundance of snow and the characteristics of winter storms than unusual dryness (see this article).  This fact was abundantly clear to Atwater and Koziol who wrote:
"Alta's typical snowfall is dry; that is, there is not enough free moisture in the snow crystals so that they will adhere when squeezed in the glove. It is varied in type: flake, granular, and pellet in all sizes and combinations. Its weight averages .092 of an inch of water per inch of snow, which is heavy for a "dry" type of snow [my emphasis]. These characteristics promote rapid settling and cohesion, those qualities of flotation without stiffness, and packing without becoming icy, which delight the heart of the skier."
The .092 inches of water per inch of snow reflects a 9.2% water content.  This is somewhat higher than the 8.4% observed in recent years, although this could simply be an artifact of changes in measuring location and techniques.

So, peruse The Alta Avalnche Studies this weekend and take a walk through the avalanche history of Alta with Monty Atwater and Felix Koziol.