Monday, August 26, 2024

A Cool Change With Antecedent High Impacts

As anticipated about a week ago, cool air pushed into northern Utah over the weekend, giving us a delightful Sunday with a high of 81 at the airport.  The 81 occurred around noon as temperatures actually decreased some in the afternoon as colder air moved in.  If my quick read of the observations over the past couple of months is correct, that's the lowest maximum temperature we've had since June 19th when the high was 80.

Snow was observed on the higher peaks as the the trough moved across northern California.  


In Utah, the pre-frontal southerlies fanned the Boulter Fire near 5 Mile Pass. I suspect this was the source of the smoke you could smell in the Salt Lake Valley on Saturday.
The fire was human caused, although I have not seen anything more specific than that.  Fire perimeter mapping shows the narrow corridor of the fire run driven by the strong winds.

Source: Utah Fire Info

There was also flash flooding Friday night in Moab.  I decided not to publish anything from social media from that event simply because I found a few videos that were actually from prior events and it was difficult to confirm some of the footage.  Elsewhere, flash flooding in the Grand Canyon led to significant search and rescue operations and the loss of at least one life.  

Enjoy today's cool and low-impact weather.  The biggest threat today might be from UV.  Don't forget to sunblock.  

Monday, August 19, 2024

Three Major Weather Players

The weather over the past week has been wonderful by my standards. Four of the past six days have seen highs in the 80s, lows have been in the 60's, and we've had measurable rain at the airport on four days.  You might have done even better than that depending on where you live.  

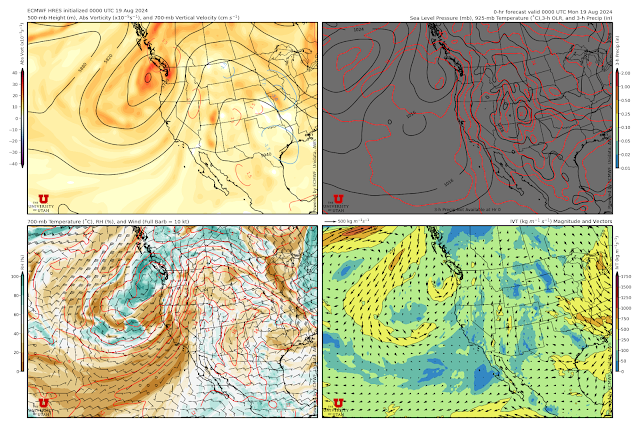
The GFS analysis for 0000 UTC 19 August (6 PM MDT Sunday) shows the situation as of yesterday afternoon.  An upper-level ridge predominates over west Texas and New Mexico with a deep upper level trough off the Pacific Northwest Coast.  


This has put Utah in a so-called "monsoonal" flow around the upper-level ridge.  

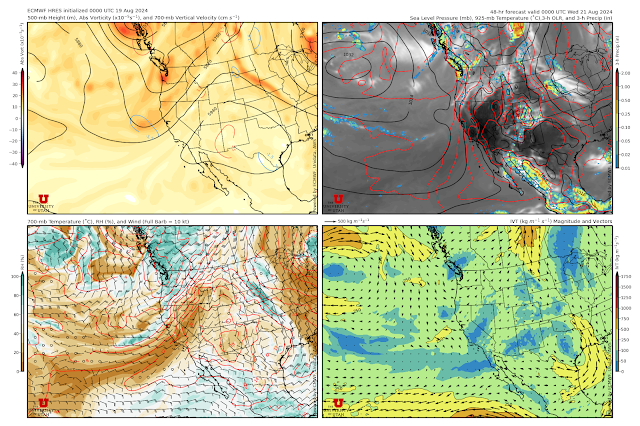
This general pattern will predominate over the next several days, with changes in the position and strength of the upper-level ridge and trough affecting our temperatures and likelihood of precipitation.  For example, the ECMWF forecast valid 0000 UTC 21 Aug (6 PM Tuesday) shows a slight westward shift in the ridge, weakening of the trough, and a bit more of a southwest (and slightly drier) flow over northern Utah.  

That will probably mean low thunderstorm chances for Tuesday in the Salt Lake Valley.  

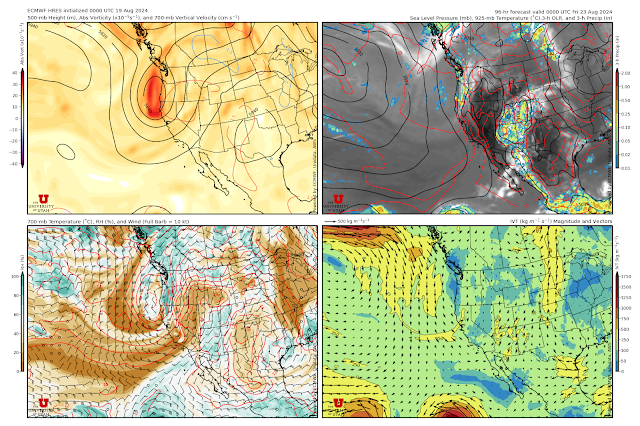
By Thursday though, a trough from the high latitudes drops into the northwest trough and the flow pattern has strengthened again, resulting in another surge of monsoon moisture and increased thunderstorm activity over southern and eastern Utah.  


Whether or not the Salt Lake Valley gets back in the action is a bit unclear.  In part, this is because there are three major weather players in that pattern.  The first is the monsoon ridge and surge with the latter streaming up from Arizona across southern and eastern Utah and Colorado.  The second is a dry southwesterly flow extending across southern California, Nevada, and northeast Utah.  Finally, the third is the cold air accompanying the Pacific trough.  In the forecast above, we're just in the dry airstream and just miss out on the monsoon surge.  Maybe we can get lucky and that surge will shift just a bit farther to the west.  

In the forecast above (valid 0000 UTC 23 August), 700-mb temperatures (about 10,000 feet above sea level) near the center of the trough off the coast of California and Oregon are about -4°C, which would be good enough for about a 7000 foot snow level if the trough were over high terrain.  Some long-range forecast models call for that trough to eventually get here, in weakened and modified form, by next weekend.  The ECMWF forecast is one.  Below is the forecast valid 1800 UTC 25 August (1200 MDT Sunday) with the trough moving across Utah.  

So, if we're lucky, we might see a decent surge of "cold" air in here over the weekend.  Highs in the 70s or low 80s are a possibility on Sunday.  


Sunday, August 11, 2024

The 25th Anniversary of the Salt Lake City Tornado

It's been 25 years since the fateful day of August 11, 1999 when an F2 tornado moved through Salt Lake City, killing one worker at the Outdoor Retailer Convention and leaving a surgical knife of debris and damage in the Avenues. 

It is still the only tornado that I have seen in person, and I hope it stays that way.  I prefer chasing powder.  

The tornado missed our house at the time by about 2 blocks.  My parents were visiting and my father told me he was eating lunch, looked out the window, shouted "holy sh-t a tornado" and yelled for my mom to grab my one year old son and run into the basement.  There was debris on our roof, so that was a very smart move.  

The best footage of the tornado was captured by the web cam operated by John Horel and the Department of Meteorology (now Atmospheric Sciences) on the roof of the Browning Building on the University of Utah Campus.  

See my post from the 20th anniversary of the tornado [The Meteorology of the Salt Lake City Tornado (1999)] for a deep dive on the event.  

Monday, August 5, 2024

How Much Water Is in the Great Salt Lake?

Aqua/Modis Satelite Image of the Great Salt Lake on 4 Aug 2024

It is not uncommon to see reports of recent or long-term trends in the Great Salt Lake characteristics based on lake elevation.  This is a quantity that is measured at three locations, two with a fairly long record.  The first is Saltair in the south arm of the great Salt Lake.  The second is Saline in the north arm.  

While convenient, they often differ by a decent amount.  This is because the lake is separated by a rock fill railroad causeway which limits the transfer of water between the two halves.  This results in differences in lake elevation (the south arm is typically higher), salinity (the north arm is saltier), and even color (see above; for an explanation see https://wildlife.utah.gov/gslep/about.html.)

However, with a little information about the lake bathymetry (i.e., the underwater terrain of the lake), one can take the elevations from Saltair and Saline, estimate the area and volume of each half of the lake, and combine them into a total area and volume for the lake.  Thanks to work by Utah State University and the USGS, tables to convert from elevation to area and volume are available at https://pubs.usgs.gov/of/2005/1327/PDF/OFR2005-1327.pdf and https://pubs.usgs.gov/of/2006/1359/PDF/ofr2006-1359.pdf, respectively.  These are based on 1/2 foot lake elevation intervals.

Based on recent readings rounded to the nearest half foot, I thought I would look at changes from August 2022, when the lake was approaching its historical minimum elevation to August 2024, the summer after two above average snowfall years.  Here's what I got.

Aug 2022
Saltair/Saline Elevations: 4189.6/4189.4 ft
Estimated Lake Area: 605,242 acres
Estimated Lake Volume: 7,419,322 acre-feet

Aug 2022
Saltair/Saline Elevations: 4193.6/4191.8 ft
Estimated Lake Area: 649,320 acres
Estimated Lake Volume: 9,528,374 acre-feet

So, in this two year period, the lake area has increased about 7% and the volume has increased about 28%.  

Feel free to pull the numbers and check my math.  However, one can see why the the former has gone up more slowly as a percentage based on the graph below which shows the volume and area as a function of lake elevation in the south arm (also known as Gilbert Bay).  Note that the slope of the area curve becomes =greater above about 4194 feet.  Basically, the lake "bathtub" has steep walls up to 4195 feet, so a given volume of water increases the area less than at higher elevations where the "bathtub" walls are more gentle.  

Source: https://www.usgs.gov/media/images/great-salt-lake-hypsographic-curve

I've used the words "estimated" above because lake bathymetry does have some uncertainties, I'm rounding off noisy lake-elevation data, etc.

If someone knows of a website that provides data on area and volume calculated based on the elevation data in the two halves of the lake, please share in the comments below.  I think that would be extremely useful to have updated monthly to better understand what is happening in each half and for the lake as a whole.

Thursday, August 1, 2024

Good Riddance to July

July is over, thank goodness.  Despite a blissfully cool start to the month (the highs on the first four days of the month were in the 80s), KSLC ended up with 10 days reaching 100 or higher and an average temperature of 83.3°F, good for 8th highest since 1874. 

Source: https://xmacis.rcc-acis.org/

Eighth might not seem too bad but it is higher than anything observed prior to 2000 (the 20th century record is 81.2°F in 1960).  The 21st century climate at KSLC is like Katie Ledecky.  She owns the 20 fastest times in the 1500-m freestyle swim, and the 21st century climate at the airport owns the 16 warmest Julys (based on mean temperature).  

The airport also received only .08" of rainfall.  There have been four previous Julys with only a trace, so this isn't a record, but it made a typically dry July even drier.  

Since I get a lot of flak about the local conditions at the airport measurement site, I'll add that this July was the 7th warmest at the Bountiful Bench COOP site, which has continuous records back to 1975.  The 15th warmest Julys there have all occurred since 2000.  

Long term trends in July are especially obvious because there's a lot less weather variability in northern Utah in July than in other months.  As a result, the long-term trend is easier to see given that there is less weather "noise."  

I don't know about you, but I'm looking forward to a cloudy, rainy day, whenever that happens.