Thursday, August 31, 2023

Labor Day Monsoon Surge

It looks like an active Labor Day weekend (not to mention tomorrow) in the weather department.  The models are advertising a potent monsoon surge similar to the two previous big ones we've had so far this summer.  

The GFS forecast below for 0000 UTC 2 September (6 PM MDT Friday) shows an upper-level trough over northern California and an upper-level ridge over Kansas. Between these two systems is southerly flow and northward vapor transport at all levels with moisture streaming into Utah from the subtropics and Gulf of California.  

Bottom line is expect showers and thunderstorms beginning tomorrow and through the Labor Day weekend.  I'll add that the models are also forecasting that the west-coast trough will become mobile over the weekend and move through Utah late Sunday and Sunday night, which could yield a frontal passage and an especially active period of thunderstorms and rain.  


It's been a wet water year (October – September), so it seems appropriate that we have wet Labor Day weekend as we enter the last month.  

My plan is to stay home and take advantage of the breaks.  If you are heading out, consult National Weather Service forecasts, monitor watches and warnings, and be aware of flash flood and lightning risk.  

Monday, August 28, 2023

Expectations for the Coming Ski Season

You may have seen some guesses about what will happen this coming ski season.  Such predictions are often issued with great fanfare and overconfidence.  I'll pick on AccuWeather here because they are an easy target.  The outlook they issued in late September 2022 included the following.

"Unfortunately, we have bad news as far as the drought goes in parts of California, Nevada and the Southwest," Pastelok said. "The main storm track will be even farther north than it was the first half of the winter season last year including the late fall."

Then there was the accompanying snow outlook. 

What a spectacular crash and burn!

The reality is that these seasonal forecasts, based largely on the loading of the dice due to the anticipated presence of El Nino or La Nina, have somewhat limited practical utility for most applications.  If you didn't have any knowledge of meteorology, you might expect there to be a 33% chance of below average, 33% chance of near average, and 33% of above average precipitation in any given season.  At best, we can shift these odds just a bit.  For temperature, we can shift them a bit more simply because of the growing influence of global warming.  

So let's look at expectations for this season.  El Nino conditions are currently in place across the equatorial Pacific Ocean with the most anomalously warm sea surface temperatures (SSTs) off the South American coast, but anomalously warm sea surface temperatures extending across the entire equatorial Pacific.  

Source: NOAA Climate Prediction Center

El Nino is expected to persist through this winter (the Climate Prediction Center gives a > 95% chance it will survive through at least February).  This affects thunderstorm characteristics in the tropics, which in turn can affect the midlatitude jet stream.  Correlations between El Nino characteristics and temperatures and precipitation over the western US weigh heavily into seasonal forecasts, with recent long-term warming trends also considered. 

For Nov-Dec-Jan this leads to the dice being loaded for above average temperatures across the western Continental US.  In this case for Utah, there is a 40–50% chance of above average, or what the Climate Prediction Center calls "leaning above" (see scale at lower left).  

Source: NOAA Climate Prediction Center

For precipitation during Nov-Dec-Jan, they are loading the dice slighly for below average in the Pacific Northwest, but indicate equal chances across the rest of the western continental US.  Basically, they don't have any confidence in it going one way or the other.  


Source: NOAA Climate Prediction Center

Below are the projections for Feb-Mar-Apr.  


Source: NOAA Climate Prediction Center


Source: NOAA Climate Prediction Center

I'm a little surprised that they aren't leaning above for precipitation in portions of SoCal with El Nino being expected.  This may be due to the fact that this was issued in mid August and perhaps we'll see that appear if confidence in the El Nino grows over the next month or two.  

Bottom line here is that I see no reason to change the seasonal snowfall forecast that I have issued for the past several seasons in the Wasatch Range.

I have no idea what is going to happen. 

I guess I might add on caveat and that is that I would lean toward above average temperatures for the cool season and a vulnerable low-elevation snowpack.  As we saw last year, a favorable jet stream can still give us an enormous low-elevation snow season, and we will need probably need an active storm track with some colder storms to overcome recent warming trends and what are currently remarkably high global temperatures.  

Friday, August 25, 2023

Snowfall in the Deer Valley Expansion Area

Yesterday Deer Valley dropped one of the biggest stories in Utah ski history, announcing plans to add 16 new chairlifts, 3700 acres of terrain, and 135 ski runs in an area including, around, and above the nascent Mayflower resort.  This includes terrain south of the current Jordanelle Gondola and below the Sultan and Mayflower lifts, above the developing Mayflower resort (labeled "new base area" below), and the ridge that extends southward from Bald Mountain toward Heber Valley, including Park Benchmark Peak (9384 ft).  


That is an enormous expansion, but this is a blog about mountain meteorology and snow snobbery, so lets take a look at the meteorology.  

For my book Secrets of the Greatest Snow on Earth, I produced an analysis of mean annual snowfall in the Wasatch Range.  It illustrates what, in the 1930s, meteorologist S. D. Green called the natural advantages of the Cottonwood Canyons.  Snowfall in the high terrain around the Cottonwoods, especially Little Cottonwood, is much greater than it is on and east of the Park city Ridgeline and the Deer Valley area.  

Source: Secrets of the Greatest Snow on Earth, 2nd Edition

In fact, near the bases of Park City Mountain Resort and Deer Valley, snowfall is about 40 to 50 percent lower than found at comparable elevations in Little Cottonwood Canyon.  This is largely a consequence of being on the climatological leeward side of the central Wasatch.  

I've identified the area of the Deer Valley expansion in yellow in the figure above.  Snowfall at the base of the Mayflower area is probably around 150 inches.  The terrain between Jordanelle Gondola and Mayflower and below the base of the Sultan chair probably averages 150 to 200 inches of snow a year, with the highest amounts near the base of the Sultan Chair at just over 7500 feet.  Near the summit of Park Benchmark Peak the averages will probably be a bit over 300 inches.  

The area will be favored in southerly to southeasterly flow storms that favor heavy snowfall in the current Deer Valley Resort.  Probably the best terrain for powder skiing, will be the northeast facing shots off the ridgeline that extends southward and southeastward from Park Benchmark Peak.  Depending on how far south they are going, there could be some northeast and north facing options off of other ridges a bit farther south.  

Map source: CalTopo

Due to the low elevations of much of the terrain, it will be more vulnerable to climate change.  In a warming climate, a greater fraction of precipitation that previously fell as snow will fall at rain at 7000 feet compared to 10,000 feet.  More mid-winter snow-loss events will occur at those lower elevations as well.  Even in the current climate, snowmaking for much of this new terrain is essential, and will become even more critical in the future.  

Monday, August 21, 2023

Hilary Storm Totals

As anticipated, Hilary brought quite the deluge to SoCal and Southern Nevada.  Below are non-quality-controlled gauge reports to MesoWest for the 3-day period ending this morning (there are a few erroneous observations plotted if you look).  Widespread reports of more than 2 inches in the LA Basin, 5 inches in portions of the San Gabriel Mountains, more than 5 inches in the southeastern end of the Sierra Nevada, 3 inches in the Amargosa Valley, and 5 inches in the Spring Mountains.  


A few reports that caught my eye include:

Mt. San Jacinto with 11.75".  What an unbelievable forecast by the HRRR model discussed in an earlier post.

Palm Springs Regional Airport with 3.23". The mean annual is about 5.5 and comparison with Mt. San Jacinto to the immediate west illustrates remarkable orographic enhnancement. 

Hunter Mountain with 5.89".  This site is in the mountain forming the northern end of the Panamint Valley just west of Death Valley.  Despite elevation (6880 ft), it is remarkably dry.  

Furnace Creek (Death Valley) with 1.70".  Well over half their mean annual precipitation of 2.2" and 17 times their average for August (0.10").

Spring Mountains Deluge.  I'm not sure how much faith to put in the highest reports from the Spring Mountains of Nevada, but lower sites in Kyle and Lee Canyons reported just over 5" and upper canyon sites over 7".  The Lee Canyon SNOTEL site reported 8.8" and the Bristlecone Trail site a bit higher 10.80". 


Quite an event.

Saturday, August 19, 2023

Hilary Update

It's just after noon on Saturday with a very eventful 60 hours or so on tap for SoCal, Nevada, and possibly portions of adjoining states due to one of the more significant tropical cyclone events in recent memory for the southwest US.  

According to the latest (12 PM MDT Saturday August 19), Hurricane Hilary is currently a category 3 hurricane with 115 mph winds.  Satellite imagery showed the circulation center of Hilary just west of the southern tip of Baja California with high clouds extending northward across Baja, SoCal, Nevada, and even northern Utah.  

Source: College of DuPage

Beneath those high clouds is a predecessor monsoon surge that is working its way up the lower Colorado River Valley and environs.  Radar imagery at 1200 MDT (1800 UTC) Saturday showed showers and thunderstorms in southwest Arizona and southeast California. The heaviest were near and within an area with precipitable water values at or above 50 mm (2 inches).  

Precipitable water is a measure of the total integrated water vapor content of the atmosphere with height, expressed as a depth if the vapor were condense.  Values in excess of 60 mm (2.35 inches) are very close to Yuma where upper-air sounding records extend back to 1955 and the highest observed is 2.33 inches.  

This is a juicy airmass and it is going to get juicier!

The National Hurricane Center calls for Hilary to track northward across northern Baja, SoCal, and central Nevada.  Winds are expected to weaken to tropical storm strength when it crosses into SoCal and then further as it moves into Nevada, but most of the impacts will be due to precipitation and flooding.

Source: NHC, Issued 12 PM MDT Aug 19, 2023

Thus, don't be fooled by language like Hilary being downgraded or weakening.  That pertains solely to the strength of the maximum sustained winds.  The potential for serious flooding and even some wind damage in some areas remains.  

To the former, check out the GFS total accumulated precipitation forecast from 1200 UTC 19 August (this morning) through 0000 UTC 22 August (6 PM MDT Sunday).  More than 2 inches with locally greater accumulations across portions of SoCal and south-central Nevada and local accumulations around 5 inches. 

Source: TropicalTidbits

And these are remarkably dry areas.  The GFS is putting out 4" for Death Valley, for example, which averages 2.24" a year.

The HRRR isn't quite as excited, but is still generating widespread 1-2.5+" for much of SoCal into south-central Nevada. A few high elevation areas are well over 5".

I plucked out the HRRR forecast for near Furnace Creek and it's just over 2.5".


And for Mount San Jacinto west of Palm Springs its 12.5+ inches, I think.  I say I think because my code wasn't design to handle these outrageous totals so things are being plotted completely off scale.


The NWS forecast is for 5-7" in the Mount San Jacinto area, but also enormous totals of 4-5" in Palm Springs which is approaching their average annual precipitation of about 5.5".  

Source: NWS; Issued 4:33 AM PDT 19 August

This storm will come hard and fast.  I don't really have an analog in my mind for it.  It's probably good the storm is moving rapidly so that the intense precipitation doesn't linger for another day or two.

Thursday, August 17, 2023

The Tropics Are Coming to the Southwest

Three days ago we discussed the possibility of a major monsoon surge into the Great Basin (see Intricacies of Medium Range Monsoon Forecasts).  The large-scale pattern producing that surge now looks as if it will deliver in spades to the Southwest US and Northwest Mexico over the next several days in the form of not only the surge, but also the tracking of Hurricane Hilary along Baja California and then through SoCal after it has decayed into a tropical storm or depression.  

The GFS forecast shows the situation for 1800 UTC (1200 MDT) Sunday.  Hilary is off the Baja California Coast.  Tropical moisture in the form of a Monsoon Surge streams up the Gulf of California and into the Great Basin between an upper level trough along the Pacific Coast and a beastly ridge over the central US.  The latter has maximum 500-mb heights over 6000-m, which is quite high.  


This pattern persists through 1500 UTC (0900 MDT) Monday, with Hilary weakening but moving northward and affecting southern California, the monsoon surge persisting in the Great Basin, and monsoon moisture moving around the upper-level ridge into southern Canada.  

Thus, the impacts of this event stretch from Mexico to Canada.  

The GFS forecast for the Hilary storm center is on the west side of the potential track area forecast from the National Hurricane Center.  Their cone that illustrates the probable path of the storm center covers all of SoCal and the SoCal bight before extending up into northern California or Nevada.  Hilary is expected to be a hurricane through 12 AM Sunday, weaken to a tropical storm by 12 AM Monday, and then a depression as it continues northward.  


For northern Utah, much will depend on the location of the monsoon surge and the track of Hilary and her remnants.  I'll be keeping an eye on this and am interested to see what happens across the southwest US.

Monday, August 14, 2023

Intricacies of Medium-Range Monsoon Surge Forecasts

I don't know about you, but I look forward to another rainy day or night and have started to surf through the forecasts looking for hope.  

There is some potential for later this week and weekend, but subtle differences in the large-scale pattern could make a big difference.

To illustrate this, I'll compare the GFS and the ECMWF (a.k.a. Euro) forecasts valid 0000 UTC 19 August (6 PM MDT Friday) and 1200 UTC 21 August (6 AM MDT Monday). 

The GFS forecast for 0000 UTC 19 August (6 PM MDT Friday) shows two key large-scale circulation features: (1) ridge centered over Oklahoma and (2) a trough off the SoCal coast at 500 mb (top left panel below).  Southerly flow between these two features transports moisture from the Gulf of California region up the lower Colorado River basin and into Utah.  

The tricky thing for the Salt Lake City area is that there is a sharp contrast cross northern Utah between air that originates from northern Mexico and the Gulf of California, which is relatively moist, and drier that originates of the California and Baja California coast, which is drier.  This leads to a sharp contrast in 700-mb humidity (lower left panel) and model forecast precipitation (upper right) across northern Utah.  A small shift in position could make a big difference for Salt Lake City.  Note that this situation is not all that unusual during the monsoon.  

The ECWMF forecast is remarkably similar on the large scale, but the moisture contrast is just a bit farther west.  If this were to verify, the odds of showers and thunderstorms in the Salt Lake area would be a bit higher.  

Pushing things out to 1200 UTC 21 August (6 AM MDT Monday), the GFS is positively giddy about a strong monsoon surge.  As a short-wave trough that was located over the Queen Charlottes digs into the western US, it strengthens the moisture transport up the lower Colorado River valley and into western Utah.  There may be some contributions from a tropical cyclone that is expected to develop over the eastern Pacific the next couple of days in the form of a moisture surge up the Gulf of California to supplement things.  


We might even get some severe convective storms from a forecast like that.

The Euro, however, is not as excited for Salt Lake City.  Really, the forecast isn't tremendously different.  It has a trough over the Pacific Northwest swinging in and it has a tropical cyclone in the eastern Pacific.  However, these are both more progressive, meaning that they are moving downstream faster.  This leads to the eastward moving northwest trough being a bit farther inland and the westward moving tropical cyclone just a bit farther offshore.  As a result, northwest Utah is in a drier airstream and the Gulf of Califonia surge is essentially non-existent.  There is still a monsoon surge, but it's not as potent and it may result in the action being a bit farther east. 


These two forecasts illustrate some of the sensitivities of monsoon surges to small differences in the large-scale forecast. In terms of the overall pattern, these forecasts are not that different, but the magnitude of the moisture transport and the location of moisture plumes and precipitation differ, and that matters in this case for the Salt Lake Valley.  

We will see how this all shakes out. 

Thursday, August 10, 2023

Meteorological Contributors to the Maui Fires

At least 36 people have been killed by tragic wildfires on Maui.  The NASA/USFS Fire Information Resource Management System shows fires/hotspots around Lahaina and over interior Maui.  

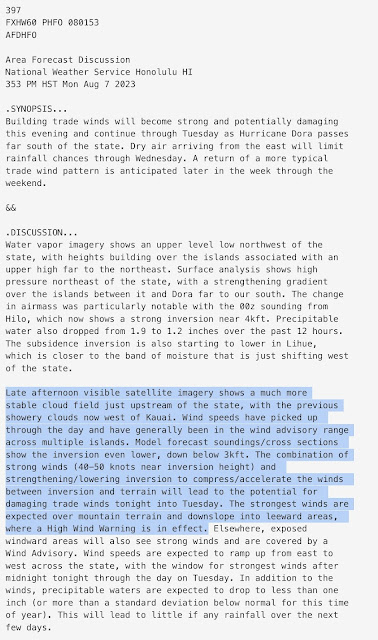
Prior to this event, the National Weather Service was well aware of the potential for strong and damaging trade winds, as evident in the forecast discussion below from 3:53 PM HST Monday August 7.   

They had also issued a red-flag warning for leeward (west) areas on the islands due to low humidity and strong winds with gusts over 60mph.  It was noted that any fires would "spread rapidly."  

I could not find any observations from the Lahaina area through my usual channels.  Instead, I will use data from the Kealia Pond National Wildlife Refuge with is about 20 km to the southeast (and south of the high terrain immediately east of Lahaina.  This difference could be very important as the topography of the Hawaiian Islands has highly localized impacts on airflows.  That said, if we look at a 7-day time series from this location, we see dramatic and important changes occurring on the 7th and 8th.  

Prior to the 7th, temperatures were generally reaching or just below 90°F each afternoon.  Dewpoints were between 60 and 70°F.  Winds would pick up each afternoon, with gusts peaking at about 30 mph.  


On the 7th, temperatures reached 95°F and afternoon winds gusted to as high as 37 mph.  Gusts over 25 mph continued overnight.  During the day on the 8th when the wildfires broke out and spread rapidly, temperatures once again climbed to 95°F, but the dewpoint also dropped to 55°F.  Wind gusts reached 53 mph shortly after noon HST.  

Media reports have mentioned Hurricane Dora.  Dora Passes well to the south of the islands, but it may have important indirect effects.  The analysis below shows the heights (black contours), wind speeds (color contours in meters per second), and winds (full barb = 5 m/s or 10 knots) at 925 mb in the days leading up to the event (the last analysis if 1800 UTC 8 August).  As Dora moves westward, the subtropical high to the north also strengthens and moves westward.  This greatly enhances the easterly trade wind flow approaching Hawaii.  


The GFS poorly resolves the Hawaiian Islands, but the topography of those islands, as discussed in the above NWS discussion, can strongly affect local airflows.  Strong winds at Kealia Pond National Wildlife Refuge likely reflected gap flows between the two primary peaks of Maui.  Numerical simulations may be needed to tease out what happened at Lahaina.

Tuesday, August 8, 2023

A Trough!

It's always exciting in the dog days of summer to see a trough embedded in the midlatitude westerlies pay a visit to Utah.

The GFS forecast below shows the trough moving through Utah at 1800 UTC (1200 MDT) August 8 (today).  At 700 mb there is even...wait for it...a temperature gradient with cold air advection (i.e., the transport of cold air into the area).  


It's difficult to find evidence of a well-developed front at the surface, but there is evidence of some enhanced northerly or northwesterly flow over the west desert and along portions of the northern Wasatch Front at around 8 AM this morning.  Winds in the Salt Lake Valley, which are often southerly or southeasterly in the morning if there's no large scale forcing, show a bit more disorganized character.   


That could reflect some of the showers that moved through, but also the fact that the surface trough is nearby or just downstream.  

The NWS forecast for today calls for scattered showers this morning and then sunny skies this afternoon with a high of...wait for it...81°F!  

ENJOY!

Friday, August 4, 2023

After the Deluge

Yesterday brought another day of heavy monsoon convection to northern Utah.  The National Weather Service 24-hour precipitation analysis for the period ending at 1200 UTC 4 August (6 AM MDT Friday) shows totals in northern Utah reaching over 5 inches in the area north of Brigham City.  


An observing site near Honeyville near that maximum reported a 48-hour total of 5.83".  There is some concern about the veracity of that sensor, so this will need to be verified, but other stations in that area reported over three inches.  

Meanwhile a bit further south, convection moved across the southern Salt Lake Valley and northern Utah County yesterday evening.  The storms produced a remarkable amount of lightning.  
The analysis above indicates maximum accumulations of between 1.5 and 2 inches, although there is one pixel that may be above 2.  A closeup of radar estimated precipitation in the Corner Canyon area shows estimates over 1.8 inches in an hour.  


Draper Mayor Troy Walker declared a state of emergency due to flooding and damaged roads.  The storm intensity was similar to the one that hit the Sugarhouse in July 2017 and put down about 2.28" in 60 minutes (see Another Look at the Deluge...although this was a different deluge!).  It was a monsoon storm producing heavy precipitation in a highly localized area overwhelming the human-built system.  Hopefully the damage is limited.

Thursday, August 3, 2023

An Impressive Monsoon Surge

What a day yesterday and what a morning this morning.  

As anticipated, a very juicy airmass moved into Utah this week.  The 5-day time-series from the airport shows the gradual increase of dewpoint and decrease of temperatures from July 29th to August 1st.  Then, dewponts really jumped on the night of the 1st, reaching 65˚F and ultimately hitting 70˚F during the day yesterday.  They have remained at or above 60˚F since about midnight on the 2nd.  

Yesterday, a powerful squall line moved northward through western Utah and ultimately through the Salt Lake Valley in the afternoon.  The loop below shows the system moving northward and illustrates how the National Weather Service tracks these storms and updates warnings accordingly. 

The 70°F dewpoint is probably near the upper end of what you'll see at KSLC, although I don't have a database here to confirm that.  It may be just shy of a record, but I'm speculating.  

Precipitation was fairly widespread in the Salt Lake Valley, with a lot of variability in amounts consistent with the convective nature of the storm.  The highest total reported to the NWS so far is 2.62" in West Valley City (through 4:50 AM).  Lower amounts are generally around 0.2".  

For the standard-time calendar day yesterday (August 2nd), KSLC reported 1.31" of precipitation.  That rates as the 16th highest calendar day total during the July to September monsoon period. 

Source: https://xmacis.rcc-acis.org/

All time, it is a less impressive #38 as there are a number of heavy precipitation events that have occurred during the fall, winter, or spring that also pip it.  Salt Lake City actually has a remarkably divers extreme precipitation climatology with events in every month in the top 50.  

I had a wonderful stroll into the office this morning in light rain with the umbrella raised.  Enjoy this cool, moist weather. 

Tuesday, August 1, 2023

The Heat Was on in July

Some impressive heat records have fallen from the month of July.  Phoenix had it's hottest month ever.

The Washington Post is reporting that is the hottest monthly average temperature ever recorded in a U.S. city, breaking the previous record of 102.2°F set in Lake Havasu City in 1996.  

My daughter lives in Phoenix and was on a flight to Seattle yesterday.  When they landed they asked everyone to lower their shades because it was "hot out." She said the entire flight erupted in laughter.  

A bit further to the north or west, Las Vegas, Kingman, and Needles all set July temperature records.  

Had enough?  How about Miami?  Warmest month on record there.

More to come I'm sure, including from elsewhere around the world.  

Meanwhile in Salt Lake City, the airport came in with an average temperature of 85.3°F.  That's a full two degrees cooler than last year's inferno, but still rates as the 3rd warmest all time.  

Source: NOAA Regional Climate Centers

Since I always get questions about the representativeness of the airport observation, I'll add that July was the 4th warmest on record at the Bountiful Bench site with an average temperature of 80.9°F, which was only 0.8°F cooler than last year.  Records there go back to 1975, but the 14th warmest Julys on record all have occurred since 2000.  

July is a bad month that is getting badder.