Wednesday, August 17, 2022

Weak Troughs Matter

Forecasting during the monsoon is often very challenging.  We talk a lot about monsoon surges, which sound quite dramatic, but sometimes the changes are more subtle.  

Currently there is a weak upper-level trough off the coast of California that will serve as an important driver of convective storms as it moves across the western United States.  

This afternoon the trough will be near the coast of California. It will help to coax monsoon moisture northward over the Sierra Nevada and western Nevada, with the HRRR producing clouds and showers (and presumably thunderstorms) that through that area and into Oregon.  

By tomorrow afternoon, the trough is near the Oregon-Nevada-California triple point and shower and thunderstorm activity has shifted eastward into eastern Nevada and western Utah.  

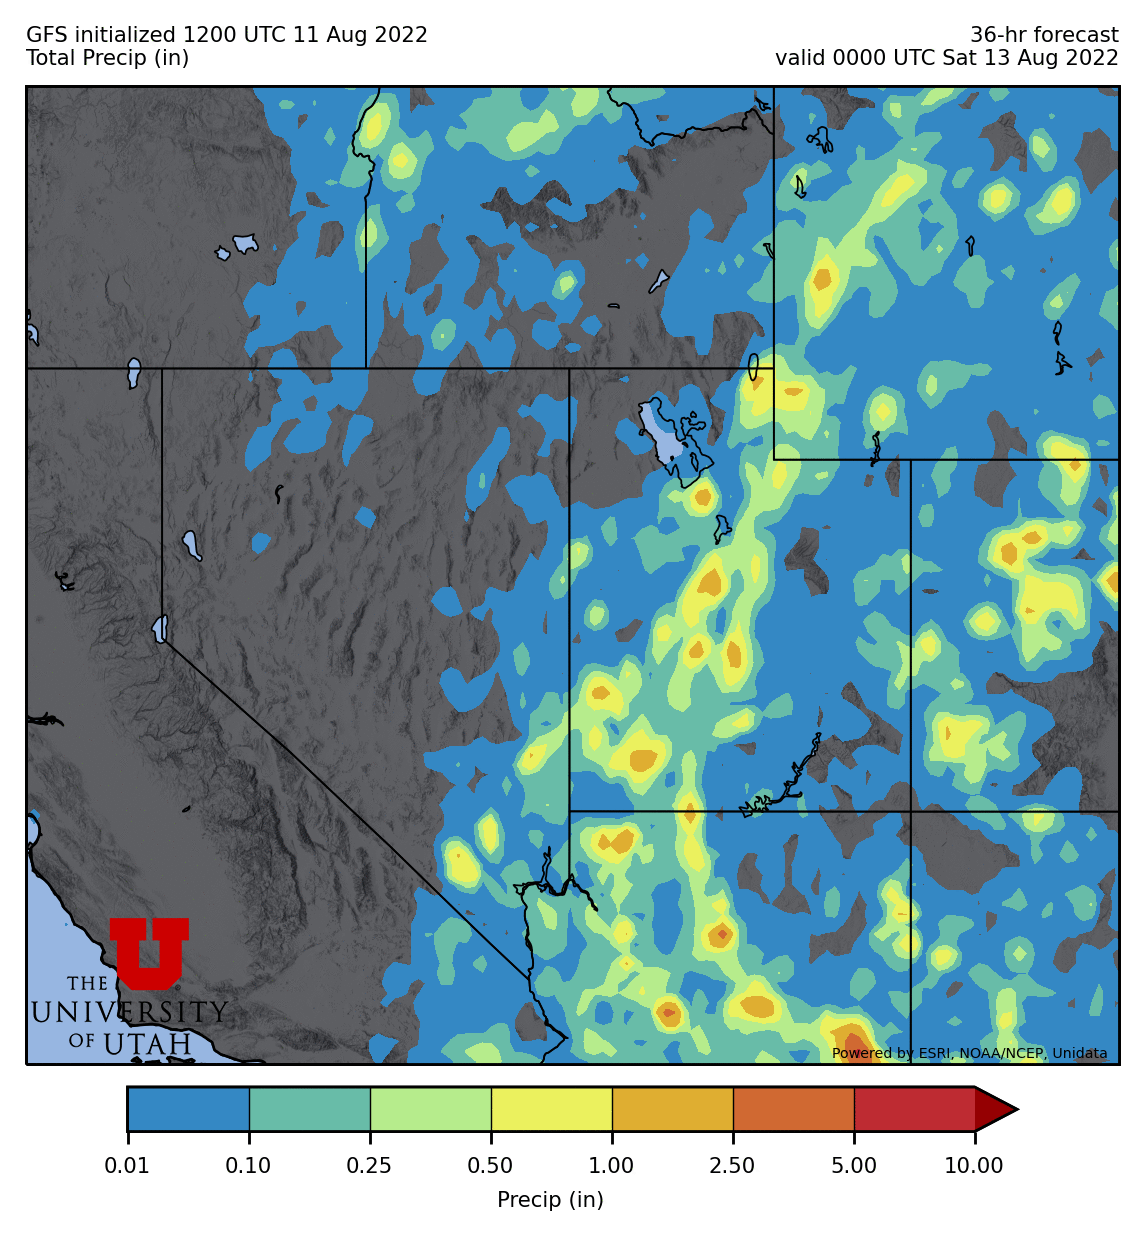
By Friday afternoon, the trough is moving into northern Utah and the GFS has moved the action into northern Utah (switching to GFS forecast below since the HRRR does not run past 48 hours).  


By most meteorological standards, the trough is quite weak.  Meteorologists often look at 500-mb geopotential height with contours every 60 meters to identify upper-level features and if you do that this morning, there's not much of anything to be seen off the coast of California.  

Source: TropicalTidbits.com

However, the trough is readily apparent if one looks at dynamic tropopause pressure and wind (upper left in the image below) or 500-mb vorticity (upper right).  These are variables that are more sensitive to flow curvature and shear and are often helpful for identifying weaker features (and they are still useful for strong features).  


Yesterday's high at KSLC was 100˚F, the 22nd time we've hit that mark this year (a new record).  As of 1:30, it is 96˚F at KSLC and we should be very near 100˚F for the maximum again today.  I personally am looking forward to a bit more cloud cover and the chance of showers and thunderstorms later this week.  

Sunday, August 14, 2022

A Moist Sunday

I hope you are enjoying the pleasantly moist and cool weather this Sunday.  We've had a pretty good run of monsoon moisture and thunderstorms in recent days and I think it is quite enjoyable.

Weather observations over the past 14 days, roughly covering the first 2 weeks of August, show three major surges of monsoon moisture during which dewpoints (blue line) predominantly sat near or above 55˚F.  These are separated by a couple of monsoon breaks during which the dewpoint was generally below 55˚F.  


Despite the hit-and-miss nature of monsoon showers and thunderstorms, most of northwest Utah has gotten a good deal of rain, with widespread areas over an inch and local accumulations of more than 3 inches in places over the past 14 days.  

Source: https://water.weather.gov/precip/

For our part of the world, that represents more than 300% of average for the period, although there are a few spots that haven't done as well (note that there are a lot of artifacts in the analyses above and below that are non-physical, so don't take them too literally.  

Source: https://water.weather.gov/precip/

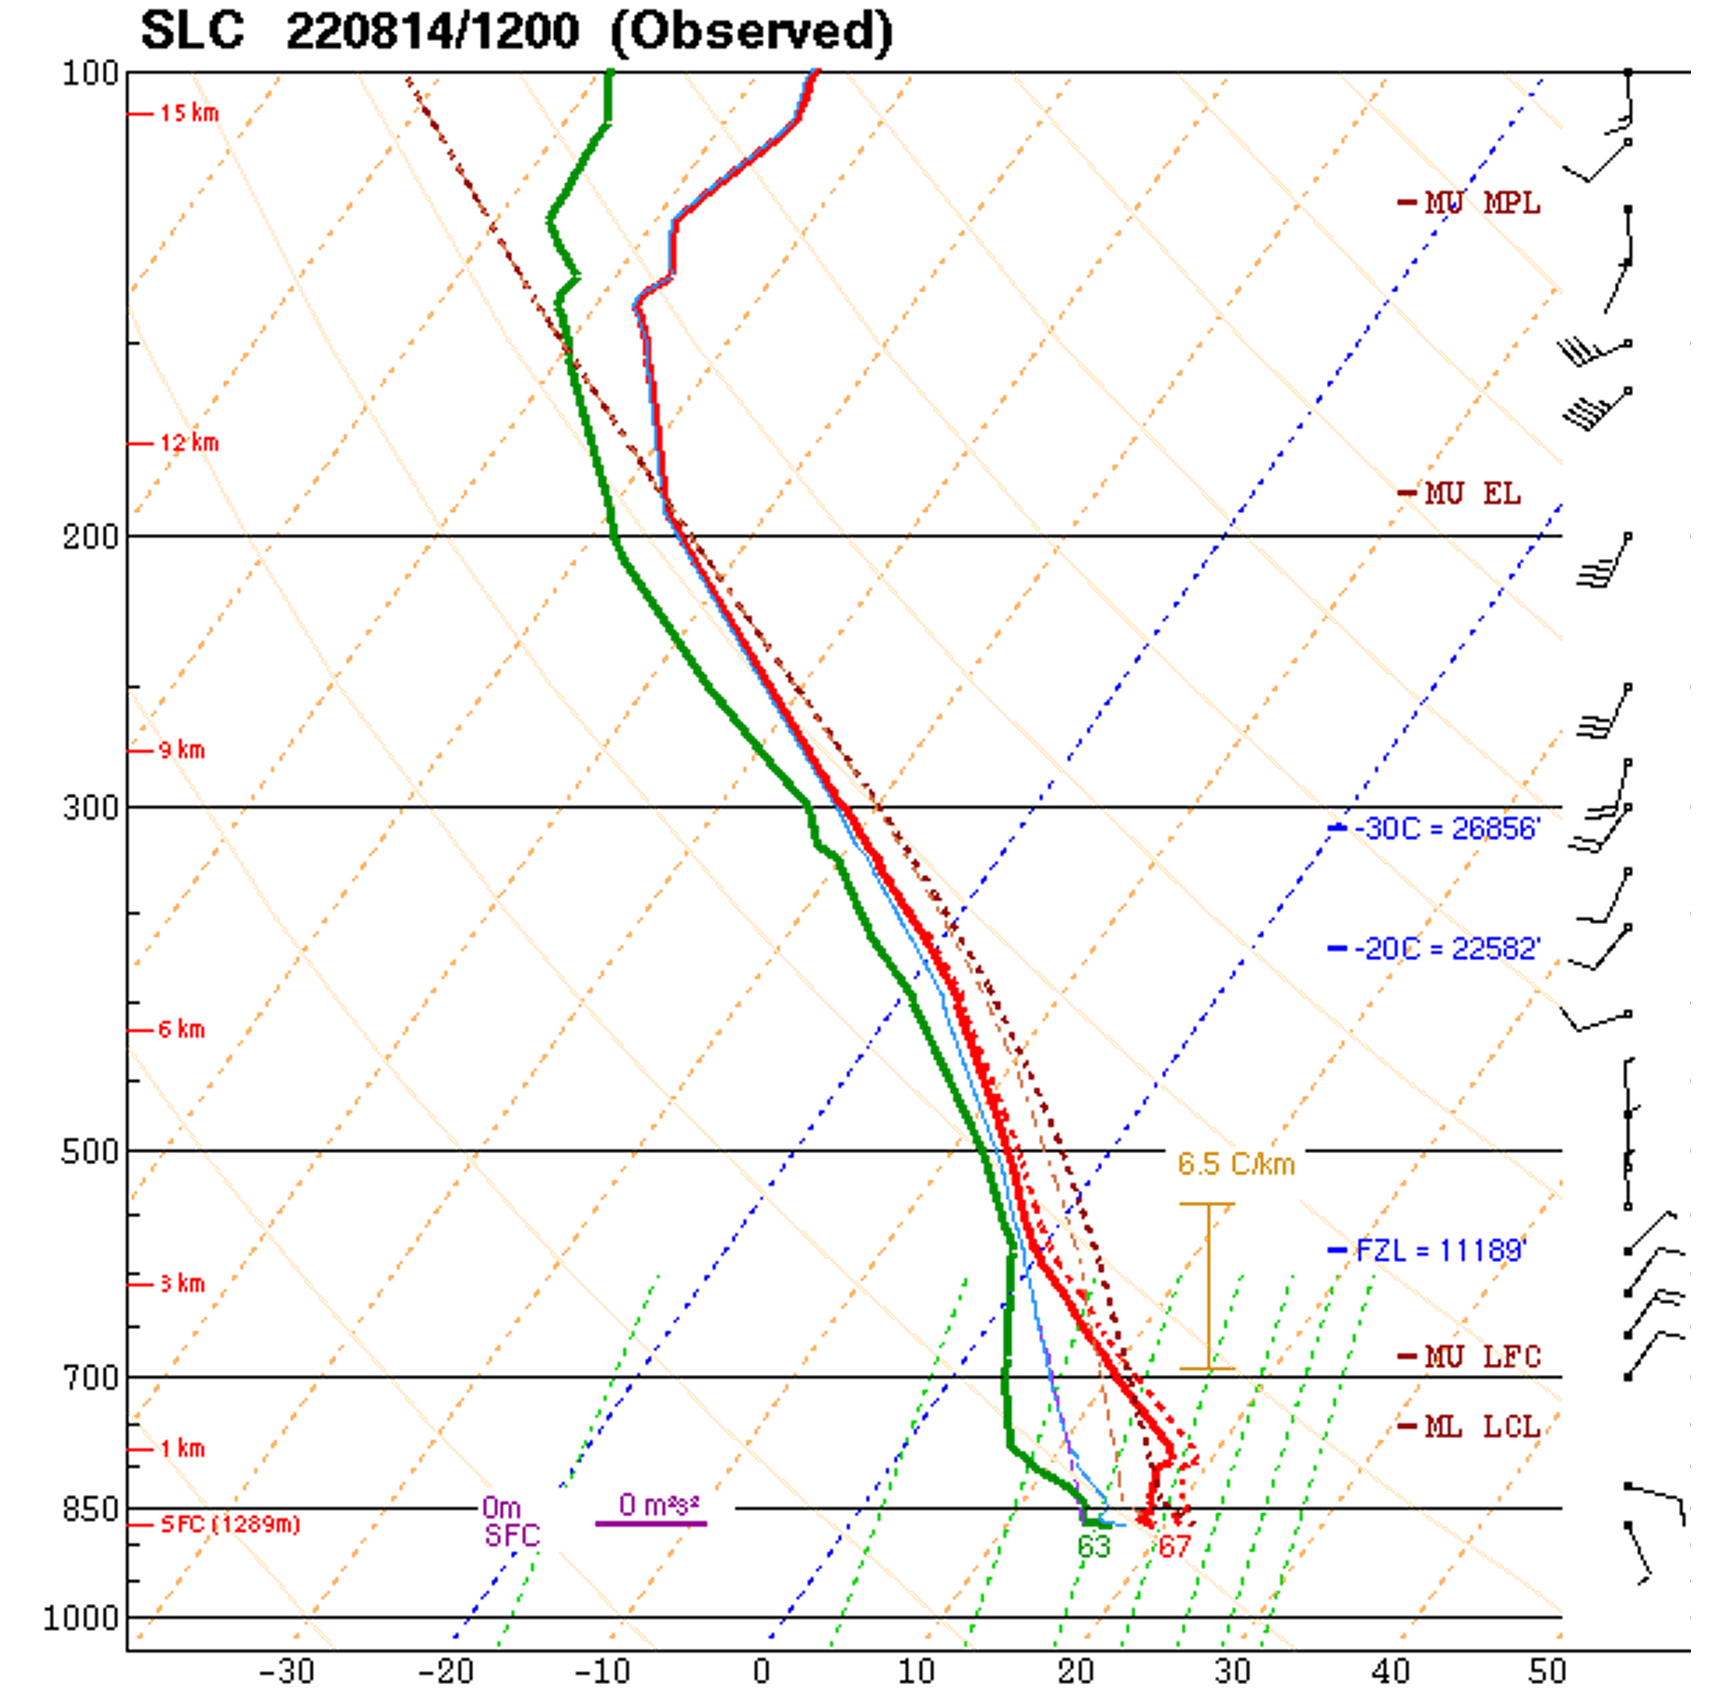
This morning's sounding is an interesting one.  The atmosphere was at or near saturation at upper levels (above 600 mb) which explains the mid-level stratus deck that we've seen for most of the day so far (more on this in a minute).  However, it is also fairly moist near the valley floor.  At the time the sounding was taken, the surface temperature and dewpoint were 67˚F and 63˚F, representing a relative humidity of 87%.


While I was mountain biking this morning, I took the photo below at 9:33 AM from the upper towers on the ridge above Ensign Peak.  The mid-level stratus deck was evident, but there were no low clouds.  


By 10:11 AM, however, as I was returning home, one could see a band of low clouds had formed near the Wasatch.  


As I write this, at 1:04 PM, the cloud band persists.


My guess is that it is being produced by the up-valley and upslope flows generated by daytime surface heating.  Much of the time around here in the summer, the valley atmosphere is to dry to generate a cloud band at such a low elevation, but that's not the case today as the relative humidity is high at low levels.  Additionally, the valley atmosphere is likely capped by a stable layer at about mid-mountain level, similar to what sometimes happens during winter inversions, so the up-valley and upslope flows are not penetrating through deep layer, but instead are capped at about mid-mountain level.  This is preventing deep penetration of the upslope flow vertically.  Instead, it hits the the stable layer, or "lid," and moves back over the valley aloft. 


These sorts of mid-slope valley clouds can be found in many mountain valleys.  Below is an example of one from the Inn Valley in Austria (see also our post Mid-Slope Valley Clouds from 31 January 2019).  


Perhaps today's cloud band is destined to die at some point today.  With surface heating, the valley atmosphere may dry out some, and the cloud band will dissipate.  Really, such a cloud band is about a zero on a meteorological scale of 1 to 10, but it does help us to understand the local flows in our part of the world.

Thursday, August 11, 2022

New GFS Products on weather.utah.edu

Upgrades to products on weather.utah.edu continue.  Today I added new hourly and total precipitation graphics for the GFS-13km dataset.  

There are actually products available on weather.utah.edu from three GFS datasets.  Products under GFS-0.25deg are based on a GFS dataset with quarter degree by quarter degree latitude/longitude grid spacing.  Products under GFS-13km are based on a GFS dataset with 13-km grid spacing.  Finally, the GFS-Downscaled products are downscaled here at the U to 800-meter grid spacing from the quarter degree GFS dataset.  

Confusing?  Try being me.  

Most people don't bother with the 13-km dataset for a few reasons.  Perhaps the main one is that it doesn't include many atmospheric variables, limiting its use for forecasting.  I don't know why this is, but it mostly includes land-surface variables.  Even precipitation is not provided except as a mean precipitation rate, which to make things complicated has varying intervals depending on the forecast hour.  It's not fun to deal with and I have to do a lot of algebraic manipulation of the data to extract hourly and total precipitation.  The math is straightforward, but it is easy to make mistakes in code.  

However, I personally like using the high-resolution precipitation in these models, although during the monsoon, the GFS precipitation is still fairly unrealistic looking.  Below are examples of the GFS-13km hourly precipitation and total precipitation from this morning's GFS run.


Compare to the corresponding HRRR forecast, which has a smaller grid spacing (3 km) and a more physically realistic (but still imperfect) structure. 

The GFS isn't designed, however, for short-range, detailed forecasts. It's designed for global forecasts going out to 16 days.  Still, the short-range forecasts from the GFS are useful and very important if you are a forecaster as no single model consistently outperforms another and in many instances ensembles of models are used for forecasting today.  

One product that is not available for the GFS-13km, but is available for the HRRR, is the radar and satellite composite.  This is because there is no synthetic radar or satellite analysis available from the GFS-13km dataset.  

Tuesday, August 9, 2022

Devastated Alpine Glaciers

It's been an awful year for glaciers and summer skiing in the European Alps. 

In 1985 there were 32 operating glacier skiing resorts in the European Alps. Not all of these operated year round, but most provided skiing for part of the warm season.  Only a handful remain today.  Two, Hintertux in Austria and Zermatt in Switzerland, have historically operated 365 days a year on upper-elevation glaciers.  Glacier areas in Saas Fe (Switzerland) and Passo Stelvio (Italy) are open in the summer but closed for other parts of the year.  Other resorts that operate for parts of the summer include Kitzsteinhorn (Austria), Mölltal (Austria), Les 2 Alpes (France), Tignes (France), and Cervinia (Italy).  Racing camps are probably a big part of their business.  

This year, however, Zermatt suspended operations on July 29.  As announced by Zermatt Bergbahnen,

"The mild winter of 2021/2022, which saw little snowfall, leaving only a thin covering of snow in Zermatt Bergbahnen's summer skiing area, combined with high summer temperatures and rainfall at over 4000 meters above sea level, necessitate a temporary discontinuation of summer skiing activities."

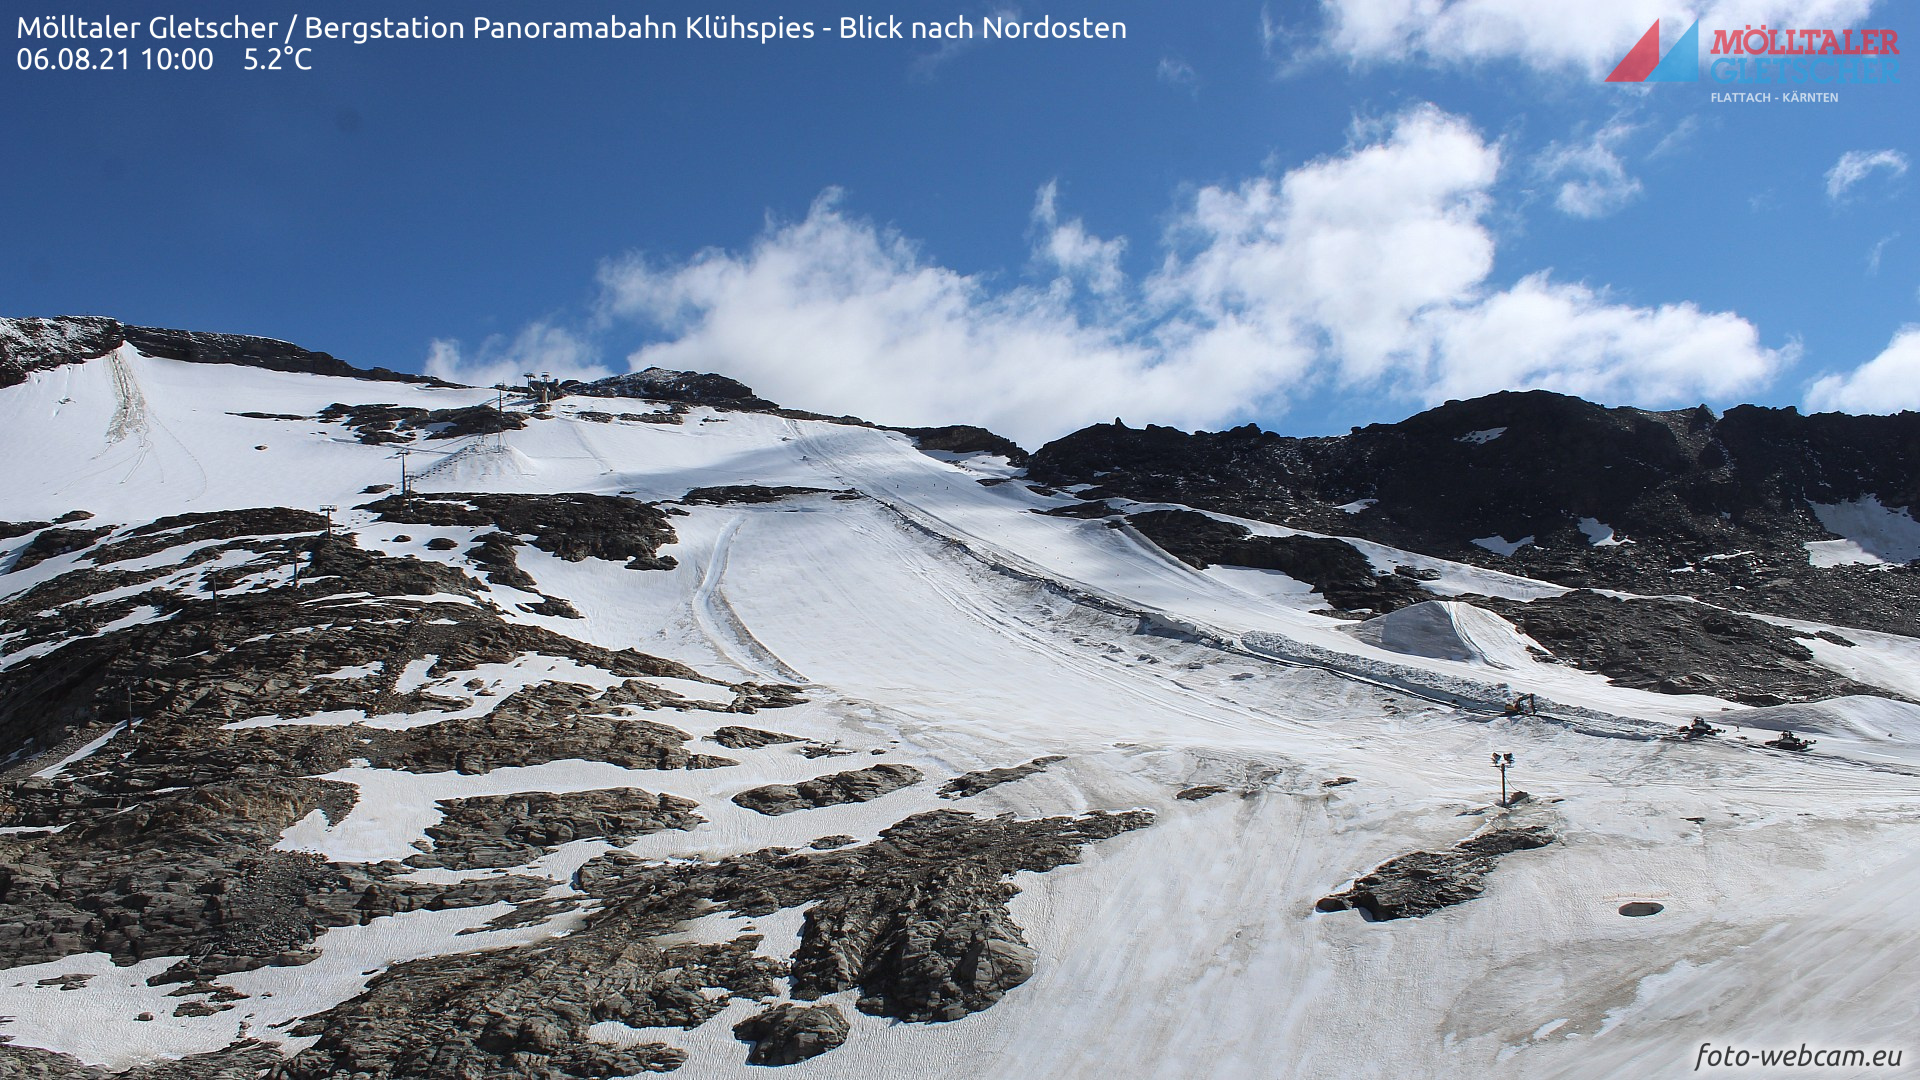
Summer skiing on glaciers typically requires seasonal snow.  The upper portions of glaciers are preferred for skiing because they often hold seasonal snow deep into or through the summer.  In recent years, tarps and snow farming have been used to preserve snow and extend the season.  I suspect at Zermatt there is a lack of sufficient seasonal snow to cover the firn (intermediate between snow and glacial ice) and glacial ice and fill crevasses.  Photos from Mölltaler Glacier in Austria from last summer and this summer show this has happened at that resort.  On August 6, 2021, a decent amount of seasonal snow cover remained on their upper-elevation terrain.  If you look carefully, you can see a couple of groomers to the right and what appear to be a few skiers and ski tracks near the top of that run.  

Source: foto-webcam.eu

This August 6, the resort is unskiable. Only a few patches of seasonal snow remain.  

Source: foto-webcam.eu

The Hintertux Glacier report from Ski Racing indicates a similar situation there, although they are still skiing (barely).  

Alpine glaciers have been losing mass for decades, but annual mass-loss rates have been increasing.  The most carefully studied glacier in Austria is the Hintereisferner southeast of Sölden and just north of the border with Italy (Scientists access the glacier via lifts at Val Senales in Italy).  Measurements illustrate a negative mass balance, meaning mass loss or summer melt exceeding winter accumulation, every year since 1983, with a trend towards larger mass losses each year.  
Source: World Glacier Monitoring Service (https://wgms.ch/products_ref_glaciers/hintereisferner-alps/)

Photos of the lower Hintereisferner show the retreat of the glacier front from 2018 to today, just a four year period.

Source: https://www.foto-webcam.eu/

Source: https://www.foto-webcam.eu/

We should see mass balance numbers for this past year fairly soon.  I suspect the numbers won't be pretty.  

Thursday, August 4, 2022

Monsoon Surge in the Offing

I'm liking what I am seeing in the latest model runs, which advertise a major surge of monsoon moisture and precipitation into northern Utah for Friday combined with forcing from a weak surface boundary to force the action.  Storminess could persist in some areas into Saturday.  

Below is the latest HRRR forecast of surface wind and 1-h accumulated precipitation valid 0000 UTC 6 August (6 PM MDT Friday).  Precipitation is mainly near or northwest of a surface boundary (shift in winds from southwesterly to the southeast to northerly or northwesterly near and behind) draped across central Nevada and northern Utah.  

The flow aloft favors the transport of deep monsoon moisture to this region, resulting in widespread shower (and thunderstorm) activity developing on Friday near and northwest of this boundary.  Showers and thunderstorms may also occur to the south of the boundary, but will be more scattered.  

Total accumulated precipitation through 0600 UTC 6 August (0000 MDT Saturday) shows the heaviest precipitation, with areas > 1 inch and pockets > 2.5" over Nevada (some of this precipitation falls today and tonight, especially over Nevada), but streaks of precipitation > 0.5" extend across northwest Utah.  Strong cells would likely produce more locally.  

The GFS sounding for the Salt Lake City airport at 2100 UTC 5 August (3 PM Friday) shows a stable layer just above the surface due to the shallow, cold northwesterly flow at low levels, but above 650 mb a skinny but deep layer of convective available potential energy or "skinny CAPE."  Total precipitable water is 32.2 mm (1.25 inches), which is fairly high for our part of the world.

Although the surface parcel in the sounding above is the "most unstable", meaning it has the highest CAPE, it is possible that some of these storms may be elevated, meaning that they are developing from instabilities above the surface rather than at the ground.  Mother Nature will provide the details.  And, while it is impossible to predict the precise characteristics and locations of convective storms at these lead times, this is a period where it will be worth monitoring forecasts and being alert to the possibility of severe weather, including heavy rain and flash flood potential. 

One possible fly in the ointment beyond the hit and miss nature of convective storms.  A look at the forecasts above shows that current forecasts call for the action to be greatest near, north, west, and southwest of Salt Lake.  This puts us on the edge of the best action.  Let's hope it doesn't shift northward or westward from advertised.  

Monday, August 1, 2022

Murderer's Row of July Temperature Records

We tied or broke virtually every temperature record related to "heat" that you can imagine during the month of July in Salt Lake City.  Buckle up.  Here we go.  

The average temperature for the month was 87.3˚F, 1.6˚F higher than the previous record set just last year and 6.1˚F higher than the highest mean July temperature observed in the 20th century (81.2˚F in 1960).  This is also the hottest month ever in Salt Lake City.  There's never been anything hotter.

http://xmacis.rcc-acis.org/

The average maximum temperature was 99.7˚F, which beats the prior record set last year by 1.3˚F.  If you want the psych point, you can round that up and say we had an average high temperature of 100˚F for the month.  

http://xmacis.rcc-acis.org/

The average minimum temperature was an incredible 74.9˚F.  This is 1.8˚F higher than the prior record set just last year and obliterates everything from the 20th century.  The 20th century record was 68.5˚F in 1919 when the National Weather Service observing site was located in what is now downtown Salt Lake City (you can see when the site was moved to the "cooler" nighttime airport location in the mid 1920s as there is a clear drop in minimum temperatures that occur at that time).  

http://xmacis.rcc-acis.org/

Shall I go on?  18 days of 100˚F or more, which is a new record.  Maximum temperature of 107˚F on July 17, tying the all-time high reached previously on 26 July 1960, 13 July 2002, and 15 June 2021.  Minimum temperature of 81˚F on July 3, tied for 2nd all-time with 18 July 2016 and just behind the record set 13 July 2021.  Highest minimum temperature for the month (68˚F) on record.  I'm not sure where we stand on the number of days with a minimum of 70˚F or more, but it was surely near the record if not the record.  

What records didn't we set?  Anything related to low minimum or low maximum temperatures.  

Is there any good news?  Not really, but the HRRR is forecasting some showers and thunderstorms for this afternoon and evening, as well as a few overnight for northern Utah, so keep your fingers crossed we at least get some precipitation action.  My house largely missed out on precipitation during July and my gardens are not happy.