Saturday, December 28, 2024

Update on the "Best Forecast (So Far) This Season"

With about 2.5" of water and 23" of snow, the Best Forecast (So Far) This Season, which we discussed on Christmas Eve, is verifying well so far at Alta Collins.  The yellow dots are my best guess of where things stand as of 8 AM/15Z this morning showing us in the upper end of water equivalent and about in the middle of the Utah Snow Ensemble forecasts.


For today, the 12Z HRRR is generating 1.25" of water and 10" high-density of snow from 8AM through 11 PM.  This is on top of the couple of inches that it was producing from 5-8 AM earlier this morning, which appears to have verified nicely.  I like another 6-12" of high-density, upside-down snow before this storm winds down this evening. Note that with the KMTX radar out, this is even more of a guess than usual.

Did I say high density and upside down?  It's a warm storm though, and getting warmer.  I suspect snow levels this afternoon will be pushing 7500 feet. They may go higher than that this evening if the precipitation hangs on. 

Tuesday, December 24, 2024

The Best Forecast (So Far) This Season

'Twas the night before Christmas when all through the house
Meteorologists were stirring, along with the mouse
The forecasts were hung by the chimney with care
In hope that deep powder, soon would be there

Now is not the time to settle your brains for a long winters nap.  The latest forecasts from the Utah Snow Ensemble are the most optimistic I've seen all season for the central Wasatch, although that admittedly is a low bar. 

Ignoring the outlier minimum and maximum forecasts, there is a tight clustering of forecasts producing  2.04 to 4.73 inches of water and 25 to 58 inches of snow for Alta-Collins by New Year's Day.  


The first storm comes in with Santa's sleigh tonight, but excitement should be tempered with the fact that it's a splitter.  The GFS shows it to be a "full latitude trough" on the west coast this morning with precipitation extending from off the SoCal coast all the way up into British Columbia.


But by Christmas morning it's split, although the GFS still gives some love to portions of Utah including 0.59" of water and 6.4" of snow for Alta-Collins.  


The HRRR though is less optimistic.  Let's call it 4-8" and if we get more you can thank Santa for the delivery.  

After that, the storms come in frequency if not size.  The GFS forecast for Alta-Collins shows both the water equivalent and snowfall (bottom two graphs below) "baby stepping" upward to 7-day totals of 3.32" of water and 35" of snow.  


These aren't huge numbers, but change sometimes comes incrementally.  I think we'll see better skiing with the approach of the New Year.  

For the valley, this first storm is not only splitting, but offering up marginal temperatures for snow.  The NWS forecast is as wishy washy as mine, calling for rain possibly mixed with snow for tonight and Christmas.  

Source: NWS, grabbed 8:35 AM 24 December

Will we have a white Christmas in the valley?  

Only Santa knows.  

Monday, December 23, 2024

Snowpack Update

A rather unscientific polling of locals on a relatively small number of chairlift rides yesterday suggests that this year is off to a slow start.  Is that really the case?

Yes.

First we can look at the snowpack water equivalent.  Three of the SNOTEL sites with long-term records in the central Wasatch, Snowbird, Brighton, and Thaynes Canyon sit at their lowest or 2nd lowest water equivalents on record.  

Source: NRCS

The Snowbird site is near the Gad Restaurant, which is currently under construction.  Site notes indicate that the pillow was moved about a hundred feet on 20 December, and indeed there is a discontinuity in the record around that time with a drop in water equivalent from 4.2", which was near the lowest on record (since 1990), to 3.2 inches, which would be the lowest on record.  


How much faith to put into the representativeness of the Snowbird measurements is unclear, but they don't paint a rosy picture.  

Brighton is the 2nd lowest on record (since 1987), although for all intents and purposes, it's pretty much at the lowest.


And of course Thaynes, which is below the prior minimum


So as not to be accused of cherry picking, the "rosiest" central Wasatch SNOTEL with long-term records is Mill D North, which actually sits a shade below median.  


Is there any silver lining in this story?

No.

But of course, there's always more to talk about.  

The sites above only have records back to at best the late 1980s.  The gold standard for central Wasatch drought remains the winter of 76/77.  In November and December of 1976, Alta-Guard recorded only 30.5" of snow and 2.04" of water.  I don't have access to Alta Guard data yet, but so far this year Alta has recorded 107" of snow and 8.6" of water at Alta Collins.  That site is higher than Alta Guard, but even with adjustments, we are still well ahead of the dreaded 76/77 drought year.  

And if misery loves company, there are any number of years in the recent past that haven't been that far ahead of this year as the holidays approached.  The current snowpack water equivalent at Brighton, for example, is very close to that observed during the 2018, 2021, and 2022 water years.  

Let's hope the snow season picks up momentum during the holidays.

Thursday, December 19, 2024

Another New Product from the Utah Snow Ensemble

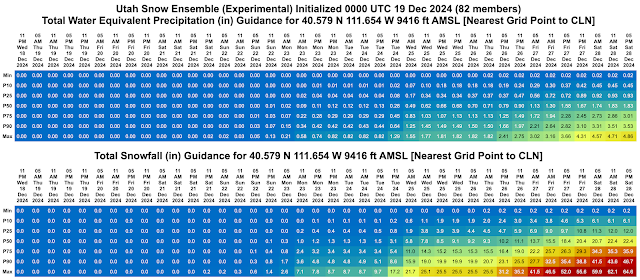
By popular demand, we now have a tabular output product from the Utah Snow Ensemble for Alta-Collins available at https://weather.utah.edu/text/ensgefsdslccforecast.html.  This should provide access to the most recently processed run and provides tables of total water equivalent precipitation, total snowfall, 6-h water equivalent precipitation, 6-h snowfall, snow-to-liquid ratio, and wet-bulb 0.5C height.  Times are local (mountain) time.  Cells are color filled by magnitude.  An example of the first two tables is below.


The row labeling for each table goes from the minimum value of the 82 ensemble members to the maximum value.  The P stand for "Percentile" so that P10 means the 10th percentile.  That means that 10% of the ensemble members are below that amount and 90% are above it.  

P50 thus is right in the middle, or what statistical types call the median.  50% of the members lie between P25 and P75 (this was corrected from a typo that said P50 incorrectly), or what statistical types call the interquartile range.  If you want to get an idea of what the range of the middle of the forecasts is, these are the rows to use.  

This is a lot to stick on a web page, so you may need to get used to zooming in and out and scrolling up and down.  I don't have time to program a proper web site so you get what you get and don't throw a fit.  At least that's what my mother told me.  

The table above is from last night's 0000 UTC forecast cycle.  We are finally starting to see some hope of a bit of storminess during the holiday period, with median snowfall at 22.4" by 5 PM Saturday 28 December.  That sets the over-under.  Are you betting over or under?

Monday, December 16, 2024

Do You Believe in Santa Claus?

These are desperate times in the natural snow department.  I supposed it could be worse.  Alta has had 105" of snow so far this year and has a base depth of 37", but these are meager numbers for mid December.  Snowpack water equivalent is the best measure of the robustness of the snowpack and we are well below median for that metric at most high-altitude observing sites in the Wasatch including 50% of median at Snowbird, 56% at Brighton, and 43% at Thaynes Canyon.  Somehow, Mill D North sits at 104% of median. Good for them, but that's still only 5.7" of water.  

The snowguns continue to blaze, but this is Utah, home of the so-called Greatest Snow on Earth.  Is there hope of a Christmas Miracle?

The truth is that the ensembles are not giving us much love. Last night's Utah Snow Ensemble came in with most members under 0.5" of water at Alta-Collins for tomorrow's storm.


A look towards Christmas shows that there are some members giving us the goods, but there are 82 members in the ensemble, and the reality is that half of them are producing 0.5" of water and 6" of snow or less.  That's the glass half empty perspective.  The glass half full perspective is that the half of them are producing more than 0.5" of water and 6" of snow.  If you are an eternal optimist, the wettest 8 members produce 1.33" or more of water and 17.4" or more of snow, which would do wonders.  

The odds are low, but this is the holiday season. Maybe we can get a Christmas Miracle.  Surely you believe in Santa Claus?

Friday, December 13, 2024

A Welcome Storm

The Alta snowstake cam suggests we're getting more action that may have been advertised by the models with perhaps 6-7 inches on the stake earlier this morning before the ski patrol wipe (kudos to my friends at OpenSnow for producing the Alta Snow Stake time laps so I could grab this image). 


And then another inch was added since then (not shown).  

The automated sensors are coming in a bit below that with about a 6" increase in the total snow depth and 6" on the interval board (ignore the spurious 34 reading at 08:00).  

Those numbers are a bit higher than advertised by the HRRR and GFS over the past few runs.  Below are the forecasts for Alta-Collins going back to 0000 UTC 12 December for snowall amounts through 9 AM this morning.  Only one of the HRRR runs went for 6" and the most recent was only an inch.  The GFS was a bit more optimistic overall, but never got above 4.5 inches.  

0Z 12 Dec HRRR: 1.1”
6Z 12 Dec HRRR: 6.0”
12Z 12 Dec HRRR: 3.3”
18Z 12 Dec HRRR: 2.4”
0Z 13 Dec HRRR: 1.0”
6Z 13 Dec HRRR: 1.0”

0Z 12 Dec GFS: 0.0”
6Z 12 Dec GFS: 3.7”
12Z 12 Dec GFS: 2.5”
18Z 12 Dec GFS: 3.4”
0Z 13 Dec GFS: 4.5”
6Z 13 Dec GFS: 4.5”

And a total of say 6-8" is also near the top of the snowiest members of the Utah Snow Ensemble over the runs since 0Z 12 Dec.  The snowiest member I could find from the last three runs of the ensemble was in the forecast below which produced about 7.5" for Alta Collins through 9 AM MST (16Z 13 Dec).  Even that was an outlier.  


Consider yourselves blessed.  Let's hope the snow keeps coming as we need all we can get.

Tuesday, December 10, 2024

The Future Is Uncertain

The physicist Niels Bohr once said that "prediction is very difficult, especially if it's about the future" and that is very evident when looking at the latest Utah Snow Ensemble (USE) plume for Alta-Collins.  The 82 members of the USE show remarkable spread for total water equivalent and snowfall over the next 10 days ranging from nearly zilch to about 2.5" water/38" of snow.  


The period features three storm systems and the 82 members can't seem to show much agreement in the intensity and timing of snowfall associated with each of them. 

We'll likely to be in a better place at the end of the 10-day period than we are now (it helps that the bar is set so low), but don't try to pin me down on details such as should I get a parking reservation at Alta for Friday, Saturday, or Sunday.  The first system moves through Thursday night and Friday, and the second Saturday night into Sunday, but I don't have any confidence concerning how much each of them will produce.

Your guess is as good as mine.

Monday, December 9, 2024

Views of a Highly Stratified Atmosphere

During the most recent inversion event, fog developed over the Great Salt Lake, eventually expanding to cover most of the lake and environs.  Below is a series of images from the NASA Terra satellite, which flys over roughly mid morning on December 4th, 6th, and 8th, the latter being yesterday (Sunday).  

It was on the 4th that fog first became evident, with a couple of regions of fog extending westward from near Antelope Island over the southern bay of the lake.


By the 6th, fog covered most of the lake.  


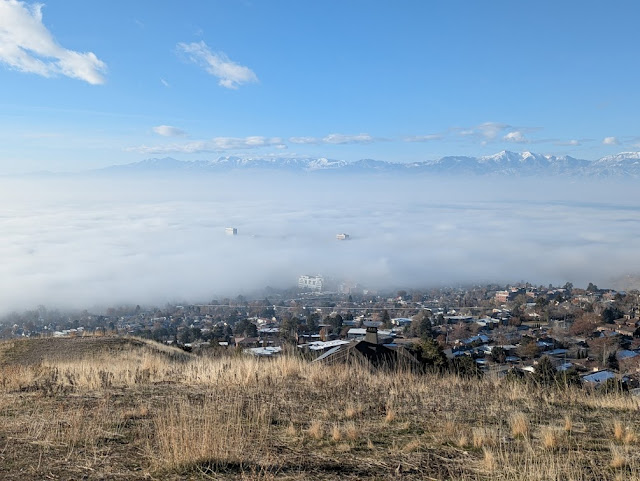
And finally, by yesterday (Sunday, 8 December), the lake was nearly entirely covered and spread into populated areas that included the northern Salt Lake Valley and portions of Davis County.  


Given the limited lowland snow cover in this instance, it is likely that the evaporation of water from the lake played an essential role in fog formation in this event, leading to fog development and persistence mainly over and near the lake.

I often tell students not to conflate the inversion with the pollution or the fog layer.  In part, this is because the stratified nature of the atmosphere during inversion events is such that neither the fog nor the pollution are perfectly colocated with the inversion.  Instead they are embedded in it or trapped beneath it.  The former was the case yesterday.

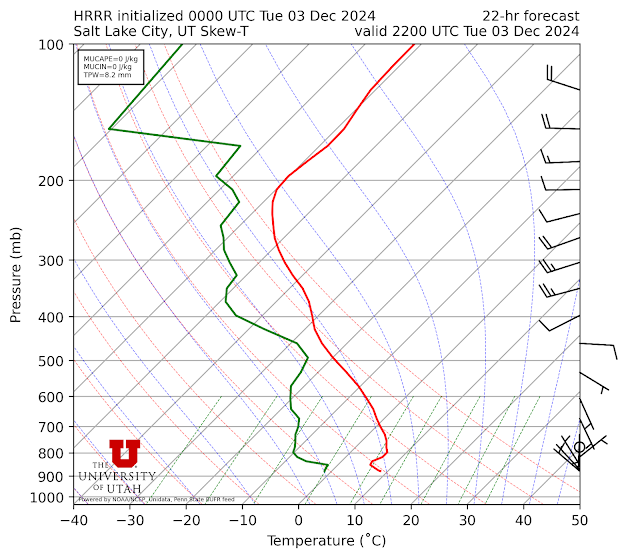
Temperatures in the morning sounding from the airport yesterday increased with height from the surface to 817 mb, or 6010 feet.  

Source: SPC

However, the fog was much shallower than that.  In fact, one was above it at about 5200 feet elevation in the Avenues foothills.


And at times the LDS office building and other tall buildings downtown rose above it.  


There was also evidence of pollution above the fog layer.  This might be inferred from the photos above but is better illustrated by one taken towards the sun and University of Utah.  In it you can see the fog, as well as complex layering of aerosols (i.e., pollution) in the atmosphere.

During inversion events, the atmosphere is often highly stable and "inverted" through a layer that is much deeper than either the fog or pollution layer.  Emissions and the transport of pollution by atmospheric flows and turbulence often occur within or beneath the inversion.  In these instances, the atmosphere is often quite stable (and often "inverted") even above the fog or pollution.  Variations in the timing and location of emissions, and the transport of them by atmospheric flows and turbulence, yield layers of "haze".  Natural emissions of water vapor from the lake are also trapped at low levels, resulting in fog formation over and near the lake, but not necessarily through the same depth as the pollution.  

In this most recent event, we ended up with a highly stratified atmosphere with fog and pollution layers.  

Thankfully, we had something to drive more mixing in the atmosphere yesteday and last night, and that was increasing flow and the decrease of temperatures aloft which were associated with an approaching trough.  Ultimately this mixed out the atmosphere, to everyone's great relief.  

Breathe easy.

Wednesday, December 4, 2024

Intricacies of this Inversion

We are currently mired in the first major inversion and air quality episode of the season, although I don't think it's been as bad as it could have.  

First, the valley is mostly snow free.  This likely leads to a bit more energy input into the atmosphere (due to less sunlight being reflected back to space and increased ground heat flux) and perhaps a bit of a decrease in particulate matter generated by photochemical processes (although this is not my area so I'm speculating).  

In the case of the former, the soundings released at the Salt Lake International Airport at 0000 UTC each afternoon are too late to capture the structure of the convective boundary layer that develops each afternoon.  The convective boundary layer is the part of the atmosphere in which surface heating by the sun leads to vigorous vertical motions (the updrafts are sometimes called thermals) and mixing.  The depth of the afternoon convective boundary layer varies from meters to kilometers, with the former happening during the strongest inversions and the latter on hot days in the summer.

HRRR model forecasts have suggested that the afternoon convective boundary layers during this afternoon have been about 50 mb or 500 meters deep.  An example is below. 

That's deeper than we would see with snow on the ground and during our strongest inversion events, which might feature a boundary layer that's only a couple hundred meters deep, leading to a bit more dilution of this event.  

For those in the northeast Salt Lake Valley, this event has also featured some enhanced easterly flow.  This is a result of the structure of the "Rex Block" pattern over the western United States.  A Rex block features an upper-level high pressure system to the north and an upper-level low pressure system to the south.  Salt Lake City has been wedged between these two features, contributing to broad easterly to northeasterly flow in the northeastern part of the valley each morning, including this morning.  

Source: Mesowest

Such a flow pattern is not entirely unusual on clear mornings, but it seems like it may be a bit deeper and more effective at diluting the pollution each night.  PM2.5 estimates from the PurpleAir network this morning, for example, show considerable variability along the northeast bench, but several stations with low values west (and downstream in the morning) of Emigration Canyon and in the Olympus Cove Area.  In the case of the former, low values extend farther west to at least State Street.  In contrast, PM2.5 estimates are uniformly high in the western valley.  

Source: purpleair.com (screenshot at 0708 MST 4 Dec 2024)

The nocturnal "flushing" of the air pollution during this event is well illustrated by the measurements from Tracy Aviary in Liberty Park.  There is a clear see saw of PM2.5 concentrations, which drop each night and then increase each morning at about 9 AM.  

Similar but even more pronounced behavior is observed at our Mountain Meteorology Lab near the mouth of Red Butte Canyon on the University of Utah campus where we also have colocated meteorological observations.  Yesterday, for example, PM2.5 concentrations increased rapidly at about 10 AM.  Prior to that, the winds were ENE and coming down canyon.  At 10 AM, they became calm and then shortly thereafter shifted to SW, bringing in the gunk.  Then, at 5 PM, the PM2.5 began to drop.  This corresponded with the return of the ENE down valley flow.  That ENE downvalley flow persisted all night long, with PM2.5 levels dropping eventually to 5-10 ug/m2.


These trends cannot be explained by local emissions or photochemistry.  They are related to meteorology and the diurnal variations of winds in the northeastern Salt Lake Valley. 

Tuesday, December 3, 2024

Book Review: The Starting Zone


If you are looking for a good gift idea this holiday season, one that will expand the snow knowledge of your friends and family (or maybe yourself), look no farther than Karl Birkeland's recently published "book" The Starting Zone, available from avalanche.pressbooks.pub ($49.95).

I put book in quotes because The Starting Zone is an e-book available from the Friends of the Colorado Avalanche Information Center.  The Starting Zone is a living document, with tons of figures and videos and more references than you can shake a stick at (these are footnotes, so they don't clutter up the reading).  Everything is hyperlinked, allowing you to watch videos or access supporting materials with the click of the mouse or a tap of the finger (I read it on my tablet).  

I am not an avalanche professional or researcher, so my perspective is of a scientist in a complimentary field (meteorology) who has been backcountry skiing for more than 30 years but has little formal avalanche training.  I loved that the book was written in plain English with many opportunities to dig deeper into subject matter.  This appeals to my practical and sciency sides.

Karl is an excellent writer and does a great job of simplifying complicated subject matter.  I found the chapter on Dry Snow Metamorphism to be especially insightful.  I finally understand the differences between near surface facets and surface hoar and can now better explain the physical processes that distinguish metamorphism that leads to facets vs. rounds.  Karl utilizes laboratory experiments to illustrate many concepts, with extensive use of videos and images from micro-CT scans.  This also appealed to my sciency side, but also my bias toward visual learning.  I much prefer to be shown something rather than be told something or forced to infer from equations. 

There is one oddity with The Starting Zone.  It is still in the runout zone.  Sections I (Laying the Foundation) and II (The Mountain Snowpack) are finished and available except for one section (Spatial Variability at Multiple Scales).  The final section (Avalanche Release, Mitigation, and Forecasting) will be released by Fall 2025, although all three sections of the book are included in the purchase price.  Think of this as an opportunity to advance your eduction as you creep out on the slab but before you feel the collapse, hear the whumpf, and are carried down the hill by the snowy torrent.  Perhaps what you learn from Sections I and II will keep you from creeping out on that slab in the first place. Not everyone in that situation gets a second chance.