Wednesday, July 31, 2024

Forecasting Smoke


The primary tool for forecasting smoke in the United States is a modeling system known as HRRR-Smoke.

HRRR stands for the High Resolution Rapid Refresh, a high resolution developed by the NOAA Earth System Research Laboratories in Boulder Colorado.  The HRRR is actually based on the Weather Research and Forecasting model (WRF), which was developed by the National Center for Atmospheric Research.  Yes, I know this gets confusing.  I can't keep up with it either.  

HRRR-Smoke is based a version of the WRF model that includes coupled air chemistry, known as WRF-Chem, in order to simulate smoke emissions and transport.  It also allows for the effects of smoke particles and other aerosols to be considered for the models precipitation processes.  This is known as "aerosol aware microphysics parameterization."  

HRRR-Smoke forecasts can be accessed at many web sites and on many apps including OpenSnow.  They can also bee accessed through NOAA at https://rapidrefresh.noaa.gov/hrrr/HRRRsmoke/.  Smoke transport is inherently three dimensional.  There are times that smoke concentrations may be high aloft but near zero at the surface and others where concentrations are hazardous at the surface.  This site provides graphics of smoke concentrations (in µg/m3) near the surface, 1000 ft above ground level (AGL), and 6000 feet AGL.  Here, the surface or ground is based on the model topography, not the real topography.  Although a reasonable approximation, the HRRR does not resolve fine-scale topography, such as the details of the ridge-canyon geometry in the central Wasatch Range.  There is also a vertically integrated smoke product, which sums the concentrations vertically.  

Below is the near-surface smoke analysis from HRRR-smoke for 1200 UTC 31 July (6 AM MDT this morning if you are reading this on Wednesday).  The highest concentrations are near the Park Fire in northern California.  High concentrations extend westward from this fire across northern Nevada and into northern Utah.  Values in the Salt Lake Valley are around 25-30 µg/m3, which is consistent with the Utah DAQ observations from Hawthorn Elementary School this morning, which are just over 30 (i.e,. the upper end of "moderate" air quality).  


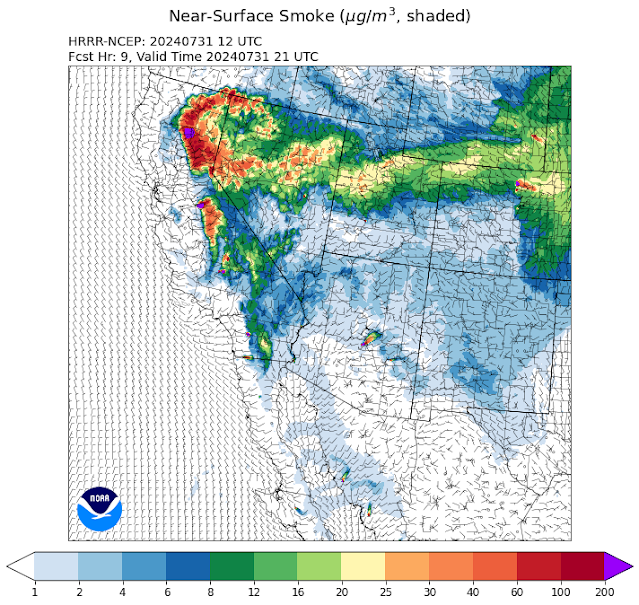
Below is the near-surface smoke forecast valid for 2100 UTC 31 July (3 PM MDT this afternoon).  Noticed that concentrations have dropped over northern Utah, although a sliver of > 25 µg/m3 remains over the Salt Lake Valley.  These decreases partly reflect a weak trough passage and the development of low-level northwesterly flow, which is bringing in air with lower smoke concentrations.   


By 12 UTC 1 August (6 AM MDT Thursday), near-surface concentrations in the Salt Lake Valley are generally in the 12-20 µg/m3 range, although values are much lower just to the north.  Maybe we can get lucky and some of that air will get in here.  


These forecasts are quite useful, but not without their challenges.  For example, there can be missed fire detections, due to limitations in satellite imagery or ignitions near or after the initialization time.  Models are also used to estimate fire emissions and plume rise. The forecasts are also dependent on the HRRR forecast fidelity, which affects transport.  There can also be a lot of interactions between the fire, smoke, and atmosphere that are difficult to forecasts.  For instance, areas of dense smoke can effectively limit daytime solar heating, leading to thermally driven circulations that are very difficult to accurately forecast.  

In the long run, I suspect that "smoke aware" weather modeling systems like HRRR-Smoke will be the norm.  These modeling systems, whether based on traditional numerical approaches or machine learning, will include smoke, other aerosols, and atmospheric chemistry to enable the prediction of air quality and impacts on temperature, circulations, and precipitation.  

Saturday, July 27, 2024

Dante's Inferno

I spent last week in Boise attending the 2024 American Meteorological Society Mountain Meteorology Conference.  When we arrived on Sunday afternoon, it was 108˚F with smoke filled skies.  The locals did their best to maintain a sense of humor.


Wednesday afternoon is typically a recreation period for attendees.  We decided to drive up to Banks and go for a swim in the Payette River, which was thankfully cold.  On the way home, just outside of Boise, we noticed a column of black smoke set against the bronze sky from fires in Oregon.  After cresting a hill, we noticed a relatively new Ford Expedition engulfed in flames and a lot of people standing around looking at it in horror.  With little to do to help, we drove on.  Ultimately, thunderstorm outflow fanned the vehicle fire into the grass and 1500 acres apparently went up quickly before it rained and they got it under control.  Good times. 

Today (Saturday), I'm back in Salt Lake and it's been somewhat comfortable thanks to the overnight and morning thunderstorms.  At 1 PM, we're sitting at a comfy 82°F.  The airport picked up 0.01" of rain overnight and this morning, adding to the .01" they got on Thursday and .01" on Friday.  That brings the monthly total to 0.03".  If you are wondering, there have been four Julys without measurable precipitation at the airport.  .03" would be good for 12th driest since 1874, although perhaps we can add more to the tally later today.  After today, precipitation chances look fairly low (but not quite zero) for the rest of the month).  

Enjoy today because the forecasts and outlooks are not good.  Below are the 6-10 day, 8-14 day, and 3-4 week temperature outlooks from the NOAA/NWS Climate Prediction Center.


Near as I can tell, this is the meteorological equivalent of Dante's 9 circles of hell.  

Friday, July 19, 2024

I Got Nothin'

Recent weather has left me with little to say.  Hot, dry, smoky July doldrums with some afternoon convection.  For all intents and purposes, the pattern doesn't change much over the next several days.  The ridge wobbles around, but there are no big changes.  The best we can hope for is a little thunderstorm activity to at least break up the monotony.  Perhaps you felt some drops and wind last night.  Sadly, I didn't.

The National Weather Service National Blend of Models forecast for the Salt Lake City International Airport shows the situation well.  Forecast highs near 100 each day.  Perhaps a slight cool down late next week when a trough passes to our north and the ridge weakens just a bit.  

Sad.  

Friday, July 12, 2024

Temperature Observations: It's Complicated

Yesterday's maximum at the Salt Lake City International Airport was 106°F, a record for the day and just a degree short of the all-time high (107°F).  The airport measurement site has been much maligned by some as being "jacked" (i.e., too high) or unrepresentative by some.  This is a subject that we've discussed previously in this blog (see What's Up @ KSLC and Records Falling).  What I have noticed in social media is that there is a tendency to assume that the airport site is wrong and the other sites are right.  There is also a tendency to assume that the differences in maximum temperature at the various sites are due to either calibration issues or local siting characteristics.  In reality, there are many many factors that affect maximum (and minimum) temperature readings.  

There are tens of thousands of weather sensors in the United States providing data to the internet.  The MesoWest project at the University of Utah (https://mesowest.utah.edu/), which began as a collaborative endeavor with the National Weather Service in the 1990s, provides access to these observations (there are other sites that do this as well).  On the MesoWest, you can plot the maximum temperatures over the past 24 hours, which I did this morning for the Salt Lake City area.  As you can see in the numbers below, there is incredible variability.  The official airport observing site (KSLC) has the highest maximum (106°F).  It is located just south of the airport on the left-hand side of the map.  Sites near it, however, range from 103 to 105, and just bit to the northeast you can find a 101 and 102 near or at the Rose Park Golf Course.  At the University of Utah, the range is even larger, with stations reporting maximum temperatures as low as 97 and as high as 105 (the 105 is covered).  

Some of these variations are real.  Urban areas involve rich tapestries of land use that affect local temperatures.  The Rose Park Golf Course, for example, is heavily irrigated.  Other areas are concrete and built up.  During one late afternoon last summer, analyses of late afternoon temperature produced by NOAA over Salt Lake City using field measurements and satellite data show the relative coolness of the Rose Park Golf Course compared to areas near the airport or to the east of I-15.  

Source: NOAA/CAPA

But there are other reasons why maximum temperatures vary from site to site.  The reality is that many different types of instruments and processing algorithms are used to measure temperature.  Instruments have varying response times (and accuracies) and differing averaging and reporting intervals are used. This is especially important for a maximum (or minimum) temperature, which can be the result of a relatively brief spike.  

As an example, below is a time series of yesterday's 1-min temperature observations from the University of Utah observing site at the mouth of Red Butte Canyon.  The maximum temperature at this site based on 1-minute averaged temperature observations provided at 1-minute intervals was 105°F.  There were two spikes between 1400 and 1600 MDT when 105°F was reached.


Let's suppose that this station instead reported data hourly.  There are some stations that report hourly averages.  The average temperature for the 1-hour period ending at 1500 MDT was 103.1°F and for the 1-hour period ending at 1600 MDT was 103.3°F.  In this case, MesoWest would have reported a high of 103°F instead of 105°F.

Alternatively, let's suppose that this station reports a 1-min average temperature every hour.  In this case, the 1-min observation at 1500 MDT was 103.3°F and at 1600 MDT was 102.1°F.  This too would have yielded a high of 103°F instead of 105°F.  

Many stations do not report a maximum (or minimum) temperature.  They simply provide temperature observations in discrete intervals.  In this case, the "maximum" temperature is actually the highest reported temperature.  The National Weather Service observing site at the airport, however, does report a maximum temperature every six hours.  This maximum could occur between observation times.   Older reports describing the characteristics of the measurement system (known as ASOS) suggest that these maxima and minima are based on 5-minute averages updated every minute.  If this is still the case, the maximum temperature reported at the airport is based on 5-minute average temperatures calculated every minute.  I am not sure if this is still the case.  

Ultimately, it is important to recognize when comparing maximum or minimum temperatures at observing sites that there is more happening than just instrument siting and calibration.

Monday, July 8, 2024

Heat Wave Update

Northern Utah has so far been sheltered from the southwest heat wave, but that will be changing this week.  

All-time records set over the weekend include 120F in Las Vegas (old record 117F) and 124F in Palm Springs (old record 123).  Bishop, Barstow-Daggett, and Desert Rock tied their all-time highs.  

The Salt Lake City International Airport has been "blissfully cool" so far this July with temperatures maxing out in the 80s from July 1-4 and then in the low-to-mid 90s from July 5-7.  Minimum temperatures have been in the 50s and 60s.  

Temperatures, however, will be climbing during the first part of the work week and are forecast to reach the triple digits from Wednesday through Sunday.

Those forecast highs are close to, but not above records (104 for Tuesday, Wednesday, and Thursday; 105 for Friday; 107 for Saturday; 104 for Sunday), but they are close enough that one can't rule out a record being tied or falling.  

For kicks and giggles, let's look at the forecasts for Saturday, although Friday also looks blisteringly hot.  Saturday's record high just happens to be 107, the highest on record for the SaltLake city Airport (note that 107 has been reached five times).  The GFS forecast 700-mb (about 10,000 ft) temperatures for the airport at 3 PM and 6 PM on Saturday are 20.2C and 20.5C, respectively.  The highest observed by weather balloon in northern Utah is 20.2C, so this is "rarified air."  The middle 50% of forecasts from the National Blend of Models for Saturday fall between 104 and 106 degrees.  The lowest 10% are 102F or lower.  However, the upper 10% are 108 or higher, so it is not out of the realm of possibility that we crack a record. 

Take it easy and check on vulnerable friends and neighbors during this period.  

Wednesday, July 3, 2024

Hell Is Coming


Enjoy the "cool" weather this week because I just looked at the forecast and hell is coming.  

One of my rules of thumb is the 20/20 rule for temperature.  Anything below -20C or above 20C at 700 mb (about 10,000 feet) is exceptional for northern Utah.  

The latest GFS forecast for 0000 UTC 12 July (6 PM MDT Thursday) have us in the 20–22C range.


And the latest NBM forecast for the Salt Lake International Airport shows a gradual warming trend after tomorrow well into the triple digits by next Thursday with highs into the triple digits.  Of the forecasts used for the NBM, the median high is 104. The upper 25% are 108 or greater.  

Source: https://apps.gsl.noaa.gov/nbmviewer

The NWS is already messaging the potential for dangerous, record-breaking heat.  

Source: NWS, obtained 3 July 2024

A cruel reminder that July is a four-letter word.

Monday, July 1, 2024

Cool Change

With high temperatures this past weekend of 100 and 101 at the Salt Lake City International Airport, today's "cool change" is greatly appreciated.  As I write this at about 3:10 PM, the temperature at the airport is only 81 and it is looking likely that we won't even eclipse 90 today.  

Those long in the tooth might remember that Cool Change was a 70's hit for the Little River Band.

The Little River Band was from Australia, where the Cool Change is an actual meteorological phenomenon that produces dramatic temperature falls from oppressive summertime heat in southeast Australia.  

The current drop in temperature is perhaps not as large or dramatic as the Australian Cool Change, but we'll take it.  I addition, the extended forecast is actually a good one for early July, with persistent ridging upstream along the Pacific coast (e.g., GFS forecast valid 0000 UTC 7 July below) putting northern Utah in northwesterly flow.  

That's much better than the ridge being parked over us or over the four corners.  As a result, forecast highs for the airport from the National Weather Service are very pleasant this "work" week:

Tuesday: 83
Wednesday: 88
Thursday: 84
Friday: 89

Thursday is the Fourth of July, so this week is broken up for many by the holiday.  84 would be wonderful.  If you are wondering, the lowest maximum temperature observed on the Fourth of July in Salt Lake City was...wait for it...62 in 1902.  I thought that would be as much of a black swan outlier as you'll find in early July (the next lowest maximum on the Fourth of July is 72 in 1993 and 1912), but on the previous day (July 3, 1902) the high was only 58 with 0.45" of rain! 

Someone needs to go back and see if that really happened.