Wednesday, August 31, 2011

Relief in Sight, with Complications

Sick of the heat?  So am I, but relief is in sight, although there are some complications.

It has been almost 2 weeks since we had a below average minimum temperature, and event longer since we had a below average maximum temperature at the Salt Lake Airport.

Source: NWS
Further, this is the longest continuous stretch of days with a maximum temperature above 90F this year.  We all need a break.

And, as luck would have it, it is on our doorstep.  This morning a surface trough is centered near the Utah-Nevada-Idaho triple point, with cool, Pacific air somewhat upstream over southwest Idaho and Oregon.  700-mb temperatures over Salt Lake City this morning are >14C, but drop to <0C over northwest Washington.  Aahhhh.


Today we'll be in the warm southwesterly flow ahead of the trough, but cooler air is coming.  The question is how cool.  There are large differences in the forecasts produced by the models over the next couple of days.

Let's begin with the 0600 UTC NAM.  It takes its time bringing the cold air in, but when it does, it brings it in in earnest, dropping the 700-mb temperature to 3C by Friday morning.

NAM 700-mb wind and temperature forecast from 0600 UTC 31 Aug –
1200 UTC 2 Sep
The 0600 UTC GFS has a different idea.  It brings the cold air to our doorstep, but the cold air stalls, and warmer air moves in quickly by Friday morning.  In fact, the 700 mb temperature on Friday morning is 11C, 8C higher than the NAM!  That is a HUGE difference, especially if you are planning on camping out at Albion Basin.

GFS 700-mb wind and temperature forecast from 0600 UTC 31 Aug –
1200 UTC 2 Sep
Model sensitivity at such short forecast lead times rarely gets so large.   The two models essentially handle the large-scale pattern differently, with the NAM producing a compacting, amplifying 500-mb trough and the GFS a wimpier 500-mb trough that lifts into Wyoming .

NAM 500-mb height, absolute vorticity (color fill), and vertical velocity
forecast valid 0000 UTC 2 September.
GFS 500-mb height, absolute vorticity (color fill), and vertical velocity
forecast valid 0000 UTC 2 September.
I typically lean toward the GFS in situations like this, primarily because it is a global model and usually conditions over the upstream Pacific Ocean, which is not fully covered by the NAM domain, are often critical for forecasting the structure and amplitude of upper-level troughs over the western United States.  Perhaps one of our readers can dig into the cause of this huge model spread and provide a more detailed analysis.  

Tuesday, August 30, 2011

Weather Faux Pas at Alf Engen Ski Museum


I recently visited the Alf Engen ski museum, which is a great place to take family or out of town guests on a nice summer day.  The museum is free, and contains a lot of great photos and nostalgia from the 2002 Winter Olympics, but is also located at the Utah Olympic Park.  You can enjoy lunch on the patio while watching aerial ski training, or pry open the wallet for a run on the zip lines or alpine slide.

The museum is quite nice, but I'd like to see an exhibit on Utah's rich backcountry ski history.  It makes sense that they emphasize ski jumping as this is how the Engen brothers got Utah skiing started, but there were also people who were touring, especially in the Brighton Basin, long before lifts were erected in the Cottonwoods.  This is well documented in Alexis Kelner's book, Skiing in Utah: A History.  They could also include something highlighting the accomplishments of Utah's more recent backcountry adventurists.

I did see a few weather faux pas.  The lake-effect exhibit is quite sensationalistic with a number of myths and inaccuracies.  Beyond that, can you identify the myths or inaccuracies in the photos below (click to enlarge)?  In the last one, the error is geographical, not meteorological.  The first to answer correctly will go down in Wasatch Weather Weenies lore forever!


Monday, August 29, 2011

Irene Crushes Killington Base Lodge

Reports of storm damage in the mountains are beginning to trickle in.  OnTheSnow.com reports that the Killington base lodge collapsed.   The parking lot at the Pickel Barrel bar has been washed out as well.  Pity.  I think I spent a couple of nights of debauchery there in college, but can't seem to remember.  

Keene Valley in the Adirondack High Peaks was also hit hard.  The Lake Placid News reports the damage is the greatest since the "mid-19th Century."  Several bridges in the region are gone.

I'm still wondering if there were any big landslides.  Drop a comment if you hear of any.

How to Forecast the Weather

Years of education and training, and I never realized it was so simple!

Source: marisys.com

White Mountains Flooding

This is one of the more breathtaking photos I've seen from the Irene-driven flooding in the northeast.  It was taken along Wildcat Brook in the White Mountains, NH.  Photographer unknown.


Irene provides a cruel reminder that water is a primary agent for delivering tropical cyclone impacts, be it storm surge or floods.  Perhaps we put too much emphasis sometimes on maximum sustained wind and storm category.

Catskill Flooding Continued

As discussed in earlier posts, the Catskill Mountains of New York were pummeled yesterday by Irene.  Runoff from that area, combined with that from the broader-scale precipitation shield across eastern New York and Vermont has moved down river such that many areas are just now feeling the full force of the flooding.  Some photos, first from the upper reaches of the Schoharie River drainage along the Batavia Kill in Windham, NY which experienced the full wrath of the flooding yesterday.

Yesterday, Windham, NY. Photo: ABC 7 Eyewitness News
Today, Windham, NY. Photo: Austin Horse.
The Schoharie River drains into the Mohawk River.  Today along the Mohawk River in Amsterdam, NY.  The river is usually on the other side of the manor!

Today, Amsterdam, NY.  Photo: Amsterdam Recorder.
The building is Guy Park Manor, built in the late 1700s.
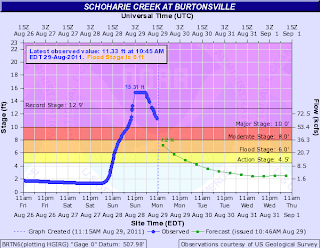
The pulse of water through the river system is shown by the two hydrographs below.  Note the earlier peak in the Schoharie River compared to the Mohawk further downstream.

Source: NOAA/NWS/AHPS
Often, the worst aspect of a tropical storm landfall is the flooding, and it can occur after the wind and rain are over.  Unfortunately, this is the case in portions of eastern New York today.

Sunday, August 28, 2011

More on Catskill Flooding

Continuing the thread from below, it appears that the Schoharie Creek at Gliboa Dam hit it's alltime record stage today at 1137.37 feet.

Source: NOAA Advanced Hydrologic Prediction Service
Residents below the dam have been evacuated.  Officials do not believe the dam is in danger of failure, so let's hope this does turn out to be purely a precautionary measure.

On a personal note, my father's family owned a camp on the Schoharie River.  I recall visiting it when I was a young boy.  It flooded many times, but typically during the spring runoff.

My parents who live in Fulton County roughly 100 km north of this area report downed trees, including four poplars, one of which fell on the neighbors truck.  My mother tells me that it was certainly as "bad as advertised."

Irene Impacts on New York's Catskill Mountains

There are some remarkable photos and videos of flooding in the Catskills on weather.com.  Keep in mind this is not storm surge.  This is runoff from torrential rains.  A sample is below, taken by David France and appropriated from YouTube.


Radar-based precipitation estimates show widespread totals of 3+ inches across the region, with areas >6" or even >8" in areas of Greene County, which lies west of Hudson (click on images to enlarge).  This is the region where many of the flood photos and videos are from.

Source: Weather Underground.  Accumulations since 27 Aug.
I'm not very familiar with the KENX radar from Albany and am not sure how trustworthy those estimates are.  On the other hand, the radar reflectivity images overnight look legit, with realistic radar reflectivity maxima, for example, at 1256 UTC in the areas of great accumulation.

Source: NCAR/RAL
At this time, strong northerly to northeasterly flow was impinging on the Catskills, as suggested in the MesoWest analysis below.


As seen in the terrain image below, such flow is oriented normal to the two NW-SE oriented ridges in the Catskills.  The radar-derived precipitation maxima lie over these ridges.


Thus, it appears we may be looking at a case of local orographic precipitation enhancement over the NW-SE oriented ridges of the Catskills.

Irene Moves into Northeast Mountains

Tropical Storm Irene has left the mid-Atlantic states behind and is now moving into northeast mountain country.  Her rain shield now covers the Catskills, Adirondacks, Green Mountains, White Mountains, and Western Mountains of Maine.

Source: NCAR/RAL
Reports from surface weather stations in those regions shows moderate to heavy rain, as indicated by the three and four dot symbols in the plot below.

Source: NCAR/RAL
Most surface stations are in valley locations, so getting a handle on ridge top winds is difficult.  The sounding this morning from Chatham, Massachusetts showed strong low-level wind shear with 20 knot winds at the surface and 50+ knots immediately aloft.


Winds at the Mount Washington observatory have just started to pick up, and are with a recent gust to 68 miles per hour, a light breeze by their standards!

Source: University of Utah/MesoWest
I suspect, however, that stronger winds are to come and that there's going to be some areas of blowdown and possibly landslides, as discussed in an earlier post.  Let's hope the damage is minimal, although northeast skiers might be hoping for a landslide or two to open up some good backcountry ski terrain...

Saturday, August 27, 2011

First Fall Cold Front?

I don't know about you, but I'm sick of the heat.  I'd love to see a morning with a minimum temperature in the 50s so I can throw the windows open and let the cool air pour in.

Thus, in addition to keeping an eye on Irene, I'm searching for signs of a cooler airmass.  It's a ways out, but the 0600 UTC GFS is showing signs of the potential of a cold-frontal passage on Thursday.


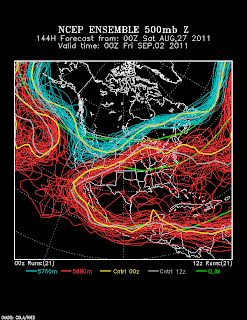
The GFS ensemble members (from 0000 UTC) all put a trough over the west, but with a wide range of positions and amplitudes.


So, we can't count on it, but even a weak trough moving into would bring some relief, even if it just knocks temperatures down a few degrees and shuns out the monsoon moisture that is keeping our minimum temperatures so high.  Let's keep an eye on the models and our fingers crossed.

Friday, August 26, 2011

The Last Day of Snow at the Paradise Snotel...

...will be today or tomorrow.  Less than 2" of SWE left.  The end of a season, but what a season it was.


Potential Mountain Impacts of Hurricane Irene

The latest forecast from the National Hurricane Center brings Irene up the eastern seaboard and eventually into the northeast United States, with the range of probable storm tracks extending from eastern New York to the Gulf of Maine.

Source: NOAA/NWS/NHC
Potential impacts to developed areas on or near the coast are of primary concern, but storms like this can also have major impacts in the mountains.  

The 0600 UTC 26 Aug forecast from the NAM has one of the more eastern storm tracks and puts the low center just off the northeast Massachusetts coast at 0300 UTC 29 Aug (11 PM EDT Sunday 28 Aug).

0600 UTC 26 Aug initialized NAM sea level pressure, 10-m wind,
and 3-h accumulated precipitation valid 0300 UTC 29 Aug.  Precipitation
shaded with dark green .01-.03 inches, green .03-.09", light green .10-.19",
aqua .2-.5", light blue .5-1", dark blue 1-2", magenta >2". 
In this forecast, the eastern Green Mountains of Vermont, White Mountains of New Hampshire, and various ranges of western Maine are squarely in the crosshairs at this time.  However, there is some uncertainty in the storm track as noted in the NHC forecast above, so a pinpoint forecast is not yet possible.

In any event, it is likely that some mountain areas of the northeast United States are going to see heavy rain and high winds, bringing the prospects of flooding, landslides, and blowdown.  

In At the Mercy of the Mountains, Peter Bronski describes some of the impacts of Hurricane Floyd on the Adirondack Mountains of upstate New York, including widespread blowdowns and eighteen landslides. 

Two of the landslides generated by Floyd were on Wright Peak, opening up prime backcountry ski terrain on one of the Adirondack "high peaks."  Unfortunately, one of the slide paths served as the site of New York State's first-ever backcountry avalanche fatality the following winter.

Time will tell where specifically Irene will strike, but it is likely that she will have some major impacts somewhere in the northeast mountains.  

Thursday, August 25, 2011

Hurricane Irene Track Forecasts

Source: UCAR/NCAR
From this morning's poor man's mixed-model ensemble.  This represents a westward shift relative to yesterday, although the CMC2 is an outlier going for something more offshore, at least for the United States.  For more discussion, see Jeff Masters' WunderBlog.

An Iconic Weather Resiliency Photo

With Hurricane Irene approaching the eastern seaboard today, the CNN blog has a report on their top-five natural weather disaster stories, with some remarkable videos and photos.

The photo below is incredibly remarkable as it encapsulates very well how weather resiliency (or lack thereof), affects the loss of life and property during weather disasters.

Source: CNN/Ray Asgar
When I first saw the photo, I figured it was photoshopped, but the accompanying discussion says that the owners, Warren and Pam Adams, lost their home during Hurricane Rita in 2005 and, when they rebuilt, they put the home on stilts 14 feet above the ground.  When the area was clobbered by Hurricane Ike in 2008, their home was the only one that survived the storm surge and winds.

Another perspective is provided by this ABC news report.


The decisions we have made in the past, and that make today, ultimately affect our vulnerability to natural disasters.

A Warm Morning

A warm airmass with just enough monsoon moisture to keep a few clouds around overnight led to a warm night last night.  As of 6 am, the minimum temperature was 78F, although we may have dipped to 77F shortly thereafter (the NWS reports max/min temperatures every 6 hours, so we're waiting for the final numbers).

That will probably make this morning's minimum temperature the highest this month.

It's always tough when you start counting on some cooler weather in late August, but Mother Nature thinks otherwise.  Climatology is 88/61, so a minimum of 77 is quite warm.

Wednesday, August 24, 2011

Sick of the Heat?

Maybe this will help....

Skier: Rick Hoffman

La Nina Ski Realities

I've been contacted a few times in the past couple of weeks to discuss the potential for a double-dip La Nina this coming winter, most recently by ESPN action sports.

The ski community is quite excited about the prospects of La Nina returning for this winter, primarily because last year was a La Nina year and it was HUGE across nearly the entire western United States with the exception of the far south.  However, there are a number of reasons why the return of La Nina, if it happens, does not necessarily mean a repeat of the winter of 2011-12.

La Nina is the cold phase of what is known as the El Nino/Southern Oscillation (ENSO) and features enhanced low-level easterly flow and relatively cold sea surface temperatures in the eastern and/or central tropical Pacific.  In contrast, El Nino is the warm phase, and features relatively warm sea surface temperatures in the eastern and/or central tropical Pacific.  Here are a couple of examples.

Sea surface temperatures during the 1998 El Nino and 1998 La Nina.
Departures from climatology on bottom.  Source: Climate Prediction Center
During La Nina events, rainfall tends to be suppressed over the central Pacific and enhanced over the Malaysian subcontinent, whereas during El Nino, the opposite typically occurs.

Precipitation during the 1989 La Nina. Departure from climatology
on right. Source: Climate Prediction Center
Precipitation during the 1998 El Nino.  Departure from climatology
on right.  Source: Climate Predication Center.
These shifts in precipitation affect the mid-latitude storm track, with a greater tendency for split flow and an enhanced subtropical storm track over the western US during El Nino years and a more northerly storm track during La Nina years.

This all sounds nice and simple, but as we say in meteorology, all generalizations are wrong.  That's not to say that they don't have value, but their application has limitations.

With regards to forecasts for the coming winter, here's why we can't count on a repeat of 2010-11 if La Nina develops:
  1. Every La Nina is different.  There are variations in strength, timing, and structure.  
  2. La Nina is an important contributor to the wintertime circulation, but it isn't the only factor.  In particular, the wintertime circulation in 2010-11 was quite anomalous and not entirely attributable to La Nina.  
  3. Weather variability, which has a random, unpredictable component at long forecast lead times, will also play a role.
This doesn't mean that we couldn't have another HUGE year in the western United States.  It could happen, even if La Nina doesn't develop.  So could a terrible snow year.  So could an average snow year.  La Nina merely shifts the odds, but our ability to predict with any degree of specificity is limited by the issues above.  

I suspect in the coming years, we will get better at dealing with the implications of items 1 and 2, and hopefully get a better handle on how important item 3 is, but for now, I'm comfortable saying that it's too soon to say with any confidence what this winter will be like across the western United States.  

If in the coming weeks we gain greater confidence that a moderate to strong La Nina will develop, and we don't know if that is indeed the case, then we may be able to start talking about the dice being loaded for certain regions of the west.  For now, I'm comfortable keeping my skis waxed and planning on taking whatever Mother Nature brings this coming winter. 

Tuesday, August 23, 2011

The Heat Is On!

For most of this summer, Salt Lake has missed out on the blistering heat we've become accustomed to the past few years, but that changes this week.

Over the past month, the large-scale pattern has featured a persistent trough along the Pacific Northwest coast and a high-amplitude upper-level ridge (a.k.a. the "death ridge") centered over Texas, as shown in the 30-day mean 500-mb height analysis for 17 July – 15 Aug 2011.


However, a subtle but important shift in this pattern is presently underway.  Over the past week, troughing over the Pacific Northwest has weakened and the upper-level ridge has built westward into the Intermountain West.


This has brought the longest stretch of days with a maximum temperature above 90F this month and minimum temperatures over the past four days of 70F or greater.

Source: National Weather Service
Computer forecast models call for this trend to continue over the next couple of days, with the center of the ridge drifting westward to the 4-corners area by tomorrow (Wednesday) afternoon.


So, the heat is on and we expect maximum temperatures at KSLC to head into the mid–upper 90s by for today, Wednesday and Thursday.

Monday, August 22, 2011

July Climate Wrapup

Our computer gurus are repairing our real-time weather storage system today, so I'm electing to take a look at the global climate highlights for July.  A summary specific to the US and Utah is available in an earlier post.

According to the National Climatic Data Center, July was the 7th warmest on record with a combined global ocean and land surface temperature 0.57C higher than the 20th century mean.  


The global analysis of surface temperature anomalies shows the above average temperatures that were observed in across the eastern 2/3 of North America.  Below average temperatures were observed along the Pacific Coast of the United States and in north-central Asia.
A take-home message from the above figure is that Mother Nature is no longer fair and balanced relative to the 20th century mean.  A greater fraction of the globe sees temperatures that are above average than below average.  

I thought I would also throw in an update from the NSIDC on the Arctic Sea Ice Extent, which is just above the record low levels (for the satellite era) observed in 2007. 

We're now about a month from the climatological minimum and the weather over the next few weeks will determine if a record will be set this year.  

Sunday, August 21, 2011

Republican Presidential Candidates and Global Warming

A quick search of YouTube this morning reveals a remarkable diversity of views on Global Warming amongst some of the current Republican presidential candidates.

Rick Perry...


Jon Huntsman...


Mitt Romney...


Michele Bachmann...


Newt Gingrich (from 2007)...


Saturday, August 20, 2011

Bryce Canyon Lightning Death

A man from Hamm, Germany was tragically killed by a lightning strike while hiking the Rim Trail near Sunset Point at Bryce Canyon Thursday afternoon.  

We have discussed lightning safety in a previous post, but we didn't discuss a human element that sometimes plays a role at National Parks and other outdoor areas where there are larger concentrations of people.  In particular, we all have a false sense of security when others are around and tend to go with the crowd when it comes to decision making.  Don't let a crowd opting to stay outside dissuade you from taking safety measures if you hear thunder or lightning is nearby.  

Friday, August 19, 2011

Ski the Andes!

Source: skiportillo.com
OK, now that I have your attention, I must confess that this post is not about skiing the Andes.  Instead, it is about the precipitation climatology of the Andes during the Austral winter, which is close enough.

It is very difficult to find good studies of the climate of the Andes, especially given the lack of data and the fact that the Andean observing network has declined in quality over the past few decades.  Nevertheless, using data from the early and mid 1970s, Maximiliano Viale and Mario Nuñez have a really nice paper on wintertime precipitation in the subtropical central Andes (30–37 S) in the latest Journal of Hydrometeorology.  Some of South America's most famous ski resorts lie in this latitude belt, including Portillo, Valle Nevado, and Las Leñas.

One of the nicer figures in the paper presents a series of transects of mean winter precipitation across the Andes from north to south.  Subfigure (b) is representative of the area along the main highway between Chile and Argentina, including Portillo.  Note how precipitation is maximized on the windward slopes and not along the Andean crest, which is common in very high mountain ranges like the Sierra Nevada and European Alps.

Source: Viale and Nuñez (2011) 
On the other hand, the southern most transect (figure d) has a much lower mountain crest.  Here, precipitation is greater near the crest, and there is more spillover into the lee.  This is the transect in which Las Leñas is found, which is good for them as they are a located in the lee of the Andes, although it is still a dry place.

There a number of other great nuggets on Andean climate in the paper, but I'll leave it to you to find the rest.

Perspective's on Tropical Cyclone Greg and Ensembles

Tropical cyclone Greg has been downgraded to tropical cyclone status and is expected to continue to weaken over the next couple of days as it moves westward across cooler water.

Source: NOAA/NWS/NHC
As mentioned in an earlier post, we are moving into the time of year when moisture from tropical storms frequently impacts the southwest United States.  What will be Greg's fate?

Meteorologists are increasingly using model ensembles for weather forecasting.  A model ensemble is essentially a group of numerical forecasts with differing model physics packages and/or initial conditions.  Because our models are imperfect, we can never define the initial state of the atmosphere perfectly, and the atmosphere is so non-linear the idea is to use the ensemble to better understand the range of possible scenarios for the future.

One such ensemble is the NCEP Global Forecast Ensemble System, which is comprised of 22 forecasts, one of which is a high resolution control run (out to 7 days), the remainder of which are lower-resolution forecasts with slightly different initial conditions.

There are many ways to visualize these forecasts, but spaghetti diagrams are amongst the most popular.  With a spaghetti diagram, you plot contours of selected variables from all the ensemble members.  It takes a while to get use to viewing these plots, but they can be quite useful.

With regards to Greg's future, I decided to look at a spaghetti diagram of GEFS precipitable water forecasts.  I've color coded the contours so that blue is 12.5 mm, light blue 25 mm, light green 37.5, orange 50, and red 62.5.  Here's a forecast loop running from 0600 UTC 19 Aug – 1800 UTC 23 Aug.


Notice the gradual growth of variability amongst the GEFS members as the forecast projection increases.   Locally high precipitable water associated with Greg moves westward in all the forecasts, with the maximum decreasing in magnitude in all the ensemble members.

Those with a good eye may notice that subtropical moisture surges out of the subtropics north of Greg beginning at about 0600 UTC 21 August.  Some, but not all of the ensemble members, bring precipitable water values >25 mm up the California coast and Central Valley.  If such a surge occurs, thunderstorms would likely develop over the Sierra Nevada.

This GEFS ensemble provides us with some situational awareness of the possibility of a surge of moisture into California.  It also tells us that there are varied predictions for the intensity of this surge.  This enables the meteorologist to assess confidence and likelihood and provide better information about the range of possible weather in the future.

Thursday, August 18, 2011

Subtle Changes

Sometimes Mother Nature hits you over the head, but other times she's more subtle.  Today we are dealing with some subtle changes in the weather.

The loop below shows the 300-mb wind vectors, precipitable water, and IR satellite imagery over the past two days.  In particular not the strong upper-level anticyclone centered over New Mexico and west Texas.  Click on it to enlarge.


Southerly flow on the back (western) side of the anticyclone has increased the precipitable water over southern Utah over the past 24 hours.  Thus, we'll see scattered showers and thunderstorms in that area today.  Northern Utah will see the thunderstorm likelihood increase a bit overnight tonight and into tomorrow.  This is not a major monsoon surge, so isolated to scattered thunderstorms are expected.

Note also the westward track of what is now Hurricane Greg (formerly tropical depression seven E) south of Mexico, which we discussed in the previous post.  I'll take a closer look at Greg either later today or early tomorrow.  He may have some mischief up his sleeves yet.