Posts

Will It Ever Snow Again?
Image
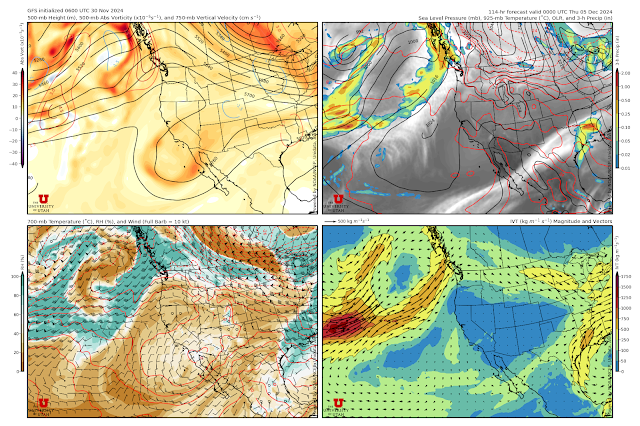
December arrives with the dreaded "Rex Block" firmly in charge over the western United States.  A Rex Block is a large scale pattern characterized by high pressure "over" low pressure as is evident in the GFS forecast valid for 0000 UTC 3 December (5 PM MST Wednesday) with an upper-level ridge centered over Oregon and a weak trough off the coast of Baja California.   Rex blocks are named for meteorologist Daniel Rex who published an early article on blocking in 1950.  Given the stability of this pattern, all members of the Utah Snow Ensemble are snow free at Alta-Collins through 0600 UTC 6 December.  After that, you can find a few members that try to bring a storm or two to Alta, but most keep us dry.    It's easier to forecast the onset of a block than its demise, so perhaps the odds will ever be in our favor as we approach 10 December, but for now anticipate dry conditions, valley inversions, and faceting snow on shady aspects.  

Different Storm Pathways

Image
What will certainly be the last storm of November and possibly the last storm for some time is now in the books.   As a recap, I thought we would do a comparison of the total storm depth change at Deer Valley Ontario (9100 feet) and Alta-Collins (9662 feet) as they illustrate two different pathways for increasing the total snow depth about 15 inches.  I've take the liberty of stretching the Alta-Collins plot from MesoWest so that the y-axis scale increments are comparable in scale to those at Deer Valley Ontario. Most of the snow at Deer Valley Ontario fell from about 0000–1400 MST Thursday (red shading).  This was during the pre-frontal storm stage discussed in the prior post (see Can You Help Explain the Overnight Snows ).   The Deer Valley Ski Patrol was caught mocking the Alta Ski Patrol on their snow-stake web cam. Of course, Alta is Mother Nature's favorite son, and with and following the passage of the front late yesterday afternoon and last night (b...

Can You Help Explain the Overnight Snows

Image
Sometimes those with investment portfolios and trophy homes get the last laugh and that was the case last night with Deer Valley the big winner in the central Wasatch.  Below is a look at the Ontario Snow Stake Web Cam at 8:05 AM showing a solid 8". Source: https://www.deervalley.com/explore-the-mountain/webcams Meanwhile, on the other side of the Wasatch, at a ski area also frequented by people with investment portfolios and trophy homes but better known for deep powder, pickings were much slimmer.   Source: alta.com This is a pattern that does sometimes bless the Deer Valley side, although I confess I don't exactly know why, in part because of poor radar coverage, poor radar estimates, and limited observational data.   The issues with radar coverage are apparent in the plot below, which shows the accumulated precipitation estimated from the National Weather Service Radar (KMTX) for the 6-hour period ending at 1400 UTC (7 AM MST).  The radar thinks th...

The Atmosphere Is a Complicated Place

Image
Introductory meteorology textbooks depict a world of cold front, warm fronts, and occluded fronts. The cold front separates two airmasses, one the colder "polar" airmass, the other the warmer "tropical airmass."  The cold front is a long-lived feature in that intrudes into the warmer airmass, lifting it and producing a band of heavy precipitation.  Chance are you have seen conceptual models of this type. If only the world were so simple. The reality is that the atmosphere is a dynamic, complicated place in which troughs, fronts, and other atmospheric features are constantly evolving.  You can't put a line on a map in one area and expect it to move continuously, without evolution into another.  The developing storm for tonight and tomorrow is a prime example. There are a lot of moving parts, to take this discussion for what it's worth: A summary of a complicated atmosphere. The GFS forecast valid at 1200 UTC 26 November (0500 MST Tuesday) is below.  I've ...

Catskills and Poconos for the Win

Image
Looking for powder?  Head east to the Catskills and the Poconos.  Some decent 24-hour totals out there, including 16.5" near Delhi.  It's a bit of a strange pattern, resulting from the downstream development that we've talked about in prior posts and which also led to the bomb cyclone in the eastern Pacific.  In the northeast, that eventually led to a deep closed low over the mid Alantic states.  Even Cleveland got in on the action for a bit.  Meanwhile, looking to our west, the upper elevation site (7617 ft) at the Mount Shasta Ski Park had a pretty good run the past couple of days for snowfall, but appears to be either in or just below the melting layer now.  Observations from that site show total snow depth increasing from 15 to 63 inches in about 24 hours,but temperatures also steadily increasing through the period.  Currently it is 35F, so I suspect they are seeing either rain, slush, or wet snow.  Quite a recipe for a deep, upside down ...

It's About to Hit the Fan

Image
Satellite imagery for the north Pacific Basin this morning is simply incredible.  I could teach an entire class based on it.  One can see all of the features discussed in the previous post, How to Break the Jet Stream , the amplifying ridge over the Bering Sea, the amplifying trough over the east Pacific, the explosively deepening cyclone off the northwest coast, and the developing atmospheric river to the south of the low center.   Source: College of DuPage The National Weather Service Ocean Prediction Center surface analysis for 0600 UTC 19 November (11 PM MST Monday) showed the nascent cyclone upstream of the California coast.  At that time it was what we call an "open wave" cyclone with a warm front, cold front, and intervening warm sector, with a central pressure of just under 1004 mb.   Source: https://ocean.weather.gov/unified_analysis.php However, in the satellite imager above, you can see the development of a clear comma-cloud signature o...

How to Break the Jet Stream

Image
A major transition in the structure of the jet stream will occur over the next few days, resulting in the development of an omega block over the Norh Pacific Basin and high-impact weather for northern California and the Northwest United States. The plot below is a combined sea level pressure (black contours) and dynamic tropopause (jet-stream level) forecast for 0000 UTC 18 November (5 PM MST Sunday). I have identified the jet stream over the North Pacific Basin and North America with a black line.  The forecast shows a deep low pressure system over the Sea of Okhutsk (at the tip of the L1 arrow).  Downstream of it, there is strong southerly flow at the surface.  L1 and the strong southerly flow ahead of it don't look at that disruptive, but combined with warming due to condensation in the precipitation system accompanying them (not shown), they serve as the proverbial straw that break's the camel's back.  By 0900 UTC 19 November (2 AM MST Tuesday), L1 has weakened, ...