Posts

Underachieving Storm, But at Least It's Cold

Image
Last nights post-frontal snowstorm turned out to be a bit of a dud.  Totals at Alta Collins from 9 AM yesterday to 7 AM this morning look to be about 6 inches, below the anticipated 8-14" in the prior post.  Such a shame.  We still remain below Steenburgh Winter status, with the snow depth topping out last night at 97" and settling to 96" this morning.  Close, but not close enough.  But at least it's cold!  Temperatures in the Salt Lake Valley are mainly in the teens, but in the mountains this morning it's single digits and sub zero.  A few observations from the central Wasatch at about 7 am: Alta-Guard: -1 (all temps ˚F) Collins: -5 Top of Collins: -8 Mt. Baldy: -11 Spruces: 4 *More on this in a minute Brighton: -2 Reynolds Peak: -5 Canyons-Murdock: -4 Park City-Jupiter: -7 Deer Valley-Empire Peak: -5 Park City Base: 6 I was surprised that Spruces wasn't colder as it's a pretty good cold trap there.  A look at the time series showed it got to as...

2021 Ends with a Bang

Image
As of 7 AM this morning, Alta-Collins has had 22 inches of snow since 10 AM yesterday with 2.08 inches of water.  Total snow depth is now at 96 inches, putting us at the precipice for Steenburgh Winter (100 inches at Alta-Collins before 10 February).   A big contributor to the water totals was an intense snowband that setup in the southwesterly flow along the Alpine Ridge between Little Cottonwood and American Fork Canyons.  Below is a screenshot showing the band at 23:43 UTC (4:43 PM MST).   From 2300–0200 UTC (4-7 PM MST) Alta-Collins recorded 1.06" of water equivalent snowfall, including 0.42" in the hour ending at 0100 UTC (6 PM MST), for an average of 0.35" per hour.  Anything at or above 0.3" really gets my attention as being out there for Little Cottonwood Canyon.  The Alta-Collins snowstake camera at 6:12 PM MST showed a dome-like pile of large graupel consistent with strong convection within the band.   Little wonder that SR-21...

Snow and Storm Snippets

Image
 A few thoughts on snow and weather as we approach the last weekend of the holiday period. It's been a decent week for skiers like myself who aren't interested in warm weather and bluebird skies.  Conditions at Mountain Dell and Round Valley have been good for skating and I've had a couple of good tours in low-angle trees as well.   I normally exile myself from the Cottonwood Canyons during the holiday week, but toured twice in Big Cottonwood, finding no lineup at the bottom and parking for our group at Spruces.  This is a small sample size, but the traffic has seemed surprisingly manageable.  Perhaps pay-to-park or the lack of sunny skies has helped.  Things may change tomorrow when the Wasangeles Snakers may be coming back to town after tonight's big dump.  There may also be <gasp> sun this weekend, especially on Sunday.   Snowpack relative to median in the central and northern Wasatch is either near- or below median depending on...

WTH Is a Snow Squall?

Image
The term snow squall has recently and forcefully entered the vernacular of Utahns as a series of strong cold fronts with intense bursts of snow and wind have moved through northern Utah over the past few days.  The most recent was yesterday afternoon. Credit: Andrea Steenburgh It promoted the issuance of snow squall warnings by the National Weather Service.   I received notification by cell phone and saw a very detailed discussion of its movement through the metro area by broadcast meteorologists, which is exactly what one would hope would happen to alert people to the rapid change in weather and road conditions.   Snow squalls are not new phenomenon.  The term is commonly used in the northeast United States where snow squalls can be produced by fronts, lake-effect storms, and other phenomena.  Here in Utah, it has sometimes been used to describe bursts of snow associated with lake-effect storms, but less commonly to describe bursts of snow associate...

Storm Cycle Update

Image
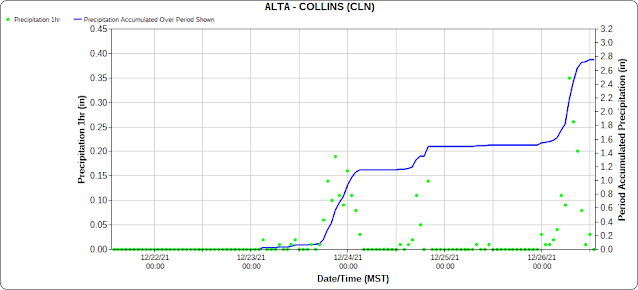
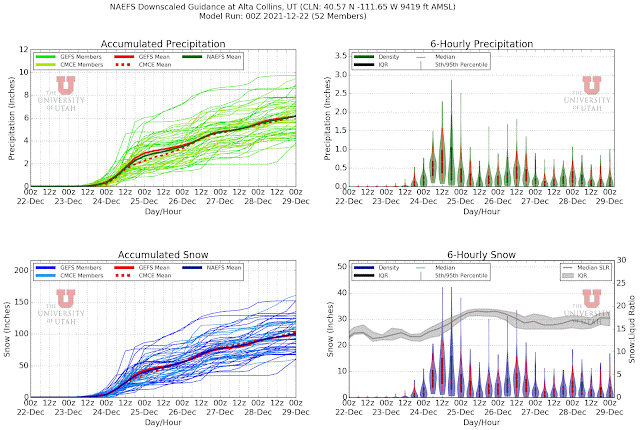
As of 1 PM MST 26 December, Alta-Collins has recorded 25" of snow and 2.78" of water since 0000 MST 23 December.  The meteogram below shows the major storm periods quite well.   I suspect most people feel the storm cycle has underperformed thusfar, so let's take a look back.  Below is the GFS-derived forecast from our blog post on 22 December.  I've added a red dot on the accumulated precipitation and snowfall traces.  The GFS was going for 3.17 inches of water, about 15% greater than observed.  That's actually not too bad for a single model.   If we look at the downscaled NAEFS, we're on the low-end, but within the range of forecast water equivalent.     My view is that the total water equivalent forecast by the GFS and the NAEFS wasn't too bad.  However, there were two important shortcomings.  The first is that the GFS and most NAEFS members called for the storm on Thursday and Friday to be much larger than observed...

It's ON!

Image
The model forecasts for the next "sevenish" days are about as good as I've seen in a long, long time.   The downscaled NAEFS product has action starting during the day tomorrow (Thursday) and the pattern remaining active through the period we generate forecasts for, which ends at 0000 UTC 29 December (5 PM MST Tuesday 28 December).   Through that time, the driest ensemble members generate almost 4 inches of water equivalent and just over 50 inches of snow.  The wettest put out ridiculous numbers around 10 inches of water and 150 inches of snow.   This product has been on the wet side this year, but lets pessimistically cut these numbers in half.  That gives a range for water of 2-5 inches and snow of about 25-75 inches, with ensemble means of about 3 and 50 inches.  Wunderbar! Our GFS-derived forecast for upper Little Cottonwood is generating just over 4 inches of water through 11  PM Tuesday, which converts to just over 50 inches of sno...

An Active Holiday Week Ahead

Image
The upper-level pattern is setting up to make the holiday week a stormy one in northern Utah.   Below are the average 500-mb height anomaly forecasts from the GEFS ensemble valid at 0000 UTC 25 December (5 PM MST 24 December) and 0000 UTC 29 December (5 PM MST 28 December).  The 500-mb level is a good proxy for the upper-level flow.  Anomalies are departures from the long-time average 500-mb heights.  Positive anomalies indicate anomalous ridging, negative anomalies anomalous troughing.  The images below show persistent ridging over the central Pacific and troughing along the Pacific Coast, a pattern that can be very good for northern Utah snowfall provided it doesn't become too amplified (i.e., the trough along the west coast becomes too deep).   Source: NOAA/ESRL/PSD Consistent with the upper-level pattern, our downscaled NAEFS ensemble product for Alta-Collins shows a major shift in the pattern beginning around Thursday December 23rd.  Unt...