Saturday, November 30, 2024

Will It Ever Snow Again?

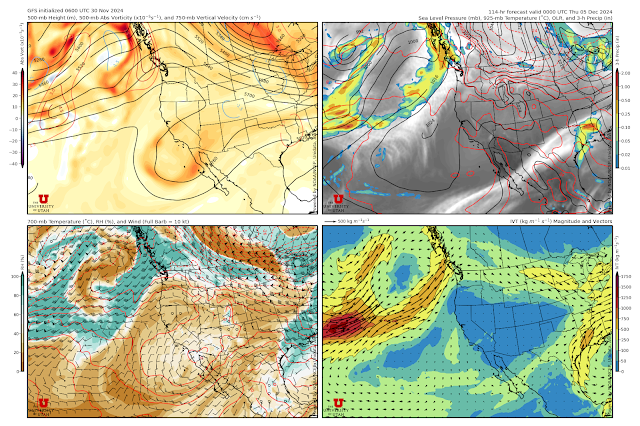
December arrives with the dreaded "Rex Block" firmly in charge over the western United States. 

A Rex Block is a large scale pattern characterized by high pressure "over" low pressure as is evident in the GFS forecast valid for 0000 UTC 3 December (5 PM MST Wednesday) with an upper-level ridge centered over Oregon and a weak trough off the coast of Baja California.  


Rex blocks are named for meteorologist Daniel Rex who published an early article on blocking in 1950. 

Given the stability of this pattern, all members of the Utah Snow Ensemble are snow free at Alta-Collins through 0600 UTC 6 December.  After that, you can find a few members that try to bring a storm or two to Alta, but most keep us dry.   

It's easier to forecast the onset of a block than its demise, so perhaps the odds will ever be in our favor as we approach 10 December, but for now anticipate dry conditions, valley inversions, and faceting snow on shady aspects.  

Wednesday, November 27, 2024

Different Storm Pathways

What will certainly be the last storm of November and possibly the last storm for some time is now in the books.  

As a recap, I thought we would do a comparison of the total storm depth change at Deer Valley Ontario (9100 feet) and Alta-Collins (9662 feet) as they illustrate two different pathways for increasing the total snow depth about 15 inches.  I've take the liberty of stretching the Alta-Collins plot from MesoWest so that the y-axis scale increments are comparable in scale to those at Deer Valley Ontario.

Most of the snow at Deer Valley Ontario fell from about 0000–1400 MST Thursday (red shading).  This was during the pre-frontal storm stage discussed in the prior post (see Can You Help Explain the Overnight Snows).  

The Deer Valley Ski Patrol was caught mocking the Alta Ski Patrol on their snow-stake web cam.


Of course, Alta is Mother Nature's favorite son, and with and following the passage of the front late yesterday afternoon and last night (blue shading), she decided to give Little Cottonwood the goods.  

Two different pathways to 15ish inches.  In the end, everyone is happy. 

Tuesday, November 26, 2024

Can You Help Explain the Overnight Snows

Sometimes those with investment portfolios and trophy homes get the last laugh and that was the case last night with Deer Valley the big winner in the central Wasatch.  Below is a look at the Ontario Snow Stake Web Cam at 8:05 AM showing a solid 8".

Source: https://www.deervalley.com/explore-the-mountain/webcams

Meanwhile, on the other side of the Wasatch, at a ski area also frequented by people with investment portfolios and trophy homes but better known for deep powder, pickings were much slimmer.  

Source: alta.com

This is a pattern that does sometimes bless the Deer Valley side, although I confess I don't exactly know why, in part because of poor radar coverage, poor radar estimates, and limited observational data.  

The issues with radar coverage are apparent in the plot below, which shows the accumulated precipitation estimated from the National Weather Service Radar (KMTX) for the 6-hour period ending at 1400 UTC (7 AM MST).  The radar thinks the heaviest precipitation is in upper Big Cottonwood, in Brighton Basin, rather than to the east in the Deer Valley Ontario area. 

Source: https://mrms.nssl.noaa.gov/

In part, this reflects differential orographic blocking of the radar, which results in weaker returns (all else being equal) in the Deer Valley area.  It could also reflect overshooting by the beam if the growth of snow crystals in this situation is shallow.  Finally, the correlation between radar reflectivity and snowfall rate (including water equivalent rate) is much lower than it is for rain, so there are times when radar estimates are simply out to lunch.  In any event, the National Weather Service radar is not all that helpful for understanding what is happening in these events.  

There is also a complete lack of upper-air observations near Deer Valley, so we have to make due with the sounding from the Salt Lake City International Airport.  This morning's sounding shows southerly winds at low levels and westerly flow at 700 mb, roughly 10,000 feet. At issue is whether or not the flow in the Heber Valley in such a pattern is lifted and produces local, shallow snowfall enhancement on the Deer Valley ridgeline.  Some have speculated this is the case, but the hypothesis has not been carefully evaluated. 

Source: SPC

Perhaps a conflicting piece of evidence in this case is that the flow direction on Mount Baldy was not southerly overnight but southwesterly.  

If it was southerly or southeasterly, it would fit this hypothesis a bit better.  Of course, there's always the possibility that wind direction is affected by local conditions and the overall flow in that area is actually ascending out of the Heber Valley.  

I have another hypothesis, although it might not be as compelling as the flow direction one.  As shown in the sounding above, the crest level flow in this case was westerly and we had near saturated conditions through a deep layer, with strong flow in the upper troposphere.  On the other hand, the low level atmosphere in the Salt Lake Valley was dry with a relatively high cloud base.  A look at radar echoes for this period showed that they were not evident right over the immediate western face of the Wasatch, but somewhat downstream. 


My hypothesis is that in this event, we are seeing a situation where there is weak orograhic lift over the western Wasatch, but it is is deep, resulting in ice crystal generation aloft. Those ice crystals are carried downstream and fall out preferentially downstream of the Wasatch Crest over Deer Valley.  

There are examples of this happening over other ranges.  The best example I can think of is a case examined by Geerts et al. (2015) in the Range of Wyoming.  They flew through the storm in an aircraft with upward and downward pointing cloud radars (the dashed line below is the aircraft flight level).  These radars don't scan, but instead collect a continuous curtain of radar data above and below the flight track, allowing the detailed vertical structure o fthe storm to be observed.  The top panels are two different flight flight tracks during the storm.  In both cases, there are no low echoes upstream of the mountain and on the windward (left) side of the crest, reflectivities are highest aloft.  They calculated the streamlines of ice crystals and showed that those generated in this windward area aloft were carried downstream and fell out on the lee side of the mountain. 

Source: Geerts et al. (2015)

That paper is a favorit of mine because it shows how you sometimes need to think beyond where the mountains are forcing rising motion. You also need to think about transport and fallout.  This is particularly important when there is crystal generation aloft, possibly well above the crest.  

Anyway, that's my story and I'm sticking to it.  Perhaps you have other ideas and can help explain the overnight distribution of snowfall.

Monday, November 25, 2024

The Atmosphere Is a Complicated Place

Introductory meteorology textbooks depict a world of cold front, warm fronts, and occluded fronts. The cold front separates two airmasses, one the colder "polar" airmass, the other the warmer "tropical airmass."  The cold front is a long-lived feature in that intrudes into the warmer airmass, lifting it and producing a band of heavy precipitation.  Chance are you have seen conceptual models of this type.

If only the world were so simple.

The reality is that the atmosphere is a dynamic, complicated place in which troughs, fronts, and other atmospheric features are constantly evolving.  You can't put a line on a map in one area and expect it to move continuously, without evolution into another.  The developing storm for tonight and tomorrow is a prime example. There are a lot of moving parts, to take this discussion for what it's worth: A summary of a complicated atmosphere.

The GFS forecast valid at 1200 UTC 26 November (0500 MST Tuesday) is below.  I've identified some of the primary large-scale features of concern for the forecast.  The first is an atmospheric river (AR), characterized by an elongated filament of high integrated vapor transport (IVT) above 250 kg/m/s, that extends from the eastern Pacific across southern California and southern Utah.  The second is an upper-level trough at 500 mb (dashed line upper left) and 700 mb (dashed line upper right).  There is another also a developing trough downstream of the Sierra Nevada, evident at 700 mb, which I've identified with a solid line at lower left. 


Below is the total precipitation produced by the High Resolution Rapid Refresh (HRRR) through this time (0500 MST Tuesday) early tomorrow morning just to highlight the higher precipitation amounts tonight in the central mountains.  From Provo north, precipitation is heaviest around Provo Peak, Cascade Ridge, and Mount Timpanogos. By and large, this reflects the position of the strongest IVT accompanying the AR over southern Utah.  

Precipitation over the Salt Lake Valley though is fairly limited.  During this period, drier air fills the valley at low levels and causes precipation sublimation or evaporation.  Eventually we get some precipitation, but it will largely be a "cloud storm" or "virga storm" tonight. 

By 0300 UTC 27 Nov (8 PM MST Tuesday), the AR has "penetrated" across the Rockies and into the central US.  In this case, don't think of the leading edge of the AR as a material surface.  The IVT across the southern Great Plans was already close to AR level earlier and the strengthening IVT in that part of the world led to IVT values ≥ 250 kg/m/s rapidly extending all the way to eastern Missouri.

Meanwhile over the Great Basin the trough downstream of the Sierra has acquired frontal characteristics.  This occurred ahead of the approaching 700-mb trough, as depicted in the lower left-hand panel below.  This is an example of discrete frontal propagation in which a new front forms ahead of the approach 700 mb trough, as often happens over the Great Basin.


With this front moving through, precipitation over the Salt Lake Valley becomes more widespread, as indicated by the 6-h accumulated precipitation forecast valid 0300 UTC 27 Nov (8 PM MDT Tuesday).  

By 1500 UTC 27 November (8 AM MST Wednesday) we are well behind the front and 700mb trough, which have merged into one feature that extends from California into the southern Great Plains.  At this time, mountain precipitation would be associated with unstable, postfrontal, northwesterly flow (a bit being produced by the GFS is in the red circle). 


So, there's a lot going on.  True AR conditions remain to the south of the Wasatch during this period, although we will get some mountain snow on the fringes of it.  Then we have the frontal passage late Tuesday and Tuesday evening, and the post-frontal period Tuesday night into Wednesday.

Let's look at some totals from the models. The HRRR is generating 1.79" of water and 19.3" of snow.  The first part of the storm is relatively warm, with the wet-bulb zero level reaching about 7500 feet  early Tuesday morning (call it a 6500-7000 foot snow level give or take at that time) before it falls late Tuesday into Wednesday with the frontal passage.  Snow through mid day Tuesday looks to be relatively high density (snow-to-liquid ratios between 8 and 11 to 1 at Alta Collins), after which we transition slowly into lower density snow. 

The GFS (not shown) is one of the drier models, putting out only 0.84" of water and 11" of snow.  

Below is a plan-view plot from the Utah Snow Ensemble for the total accumulated snowfall through 1200 UTC 28 Nov (5 AM MDT Thursday, although most of this falls through Wed evening).  The mean of the 82-member ensemble is at upper right, minimum lower left, and maximum lower right.  The mean for Alta-Collins is about 16", with a minimum of 8" and a maximum of 27". 

The large contrast between the low-end models and the high end models at this stage is a bit ulcer inducing.  The HRRR at 19.3" is nearly double the GFS at 11".  I'm inclined to be cautious in a situation like this and lean toward a storm total of 12–24" at Alta Collins.  That means this will likely come in as the biggest storm of the season so far. It will help a lot, but probably not be truly transformative.  A best case scenario would be for the AR to shift a bit northward and for the post-frontal period late Tuesday night and Wednesday to be highly productive.  

Friday, November 22, 2024

Catskills and Poconos for the Win

Looking for powder?  Head east to the Catskills and the Poconos.  Some decent 24-hour totals out there, including 16.5" near Delhi. 


It's a bit of a strange pattern, resulting from the downstream development that we've talked about in prior posts and which also led to the bomb cyclone in the eastern Pacific.  In the northeast, that eventually led to a deep closed low over the mid Alantic states. 


Even Cleveland got in on the action for a bit. 


Meanwhile, looking to our west, the upper elevation site (7617 ft) at the Mount Shasta Ski Park had a pretty good run the past couple of days for snowfall, but appears to be either in or just below the melting layer now.  Observations from that site show total snow depth increasing from 15 to 63 inches in about 24 hours,but temperatures also steadily increasing through the period. 


Currently it is 35F, so I suspect they are seeing either rain, slush, or wet snow.  Quite a recipe for a deep, upside down snowpack and rain-on-snow avalanches.  Such a waste.

Tuesday, November 19, 2024

It's About to Hit the Fan

Satellite imagery for the north Pacific Basin this morning is simply incredible.  I could teach an entire class based on it.  One can see all of the features discussed in the previous post, How to Break the Jet Stream, the amplifying ridge over the Bering Sea, the amplifying trough over the east Pacific, the explosively deepening cyclone off the northwest coast, and the developing atmospheric river to the south of the low center.  

Source: College of DuPage

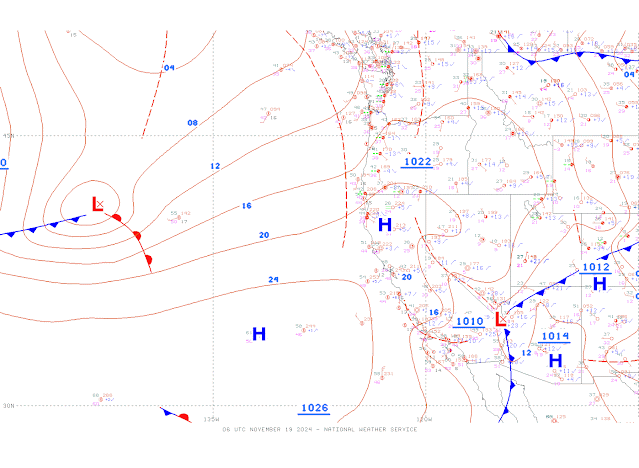
The National Weather Service Ocean Prediction Center surface analysis for 0600 UTC 19 November (11 PM MST Monday) showed the nascent cyclone upstream of the California coast.  At that time it was what we call an "open wave" cyclone with a warm front, cold front, and intervening warm sector, with a central pressure of just under 1004 mb.  

Source: https://ocean.weather.gov/unified_analysis.php

However, in the satellite imager above, you can see the development of a clear comma-cloud signature overnight, an indication of rapid deepening.  The GFS forecast called for the low center to deepen from what we'll call 1003 mb at the time above to an unbelievable 941 mb by 0000 UTC 20 November (5 PM MST Tuesday).  I'm sitting here right now wondering if I've done something wrong.  That is a drop of 62 mb in 18 hours.  The weather.utah.edu products don't include the central pressure of cyclones, so I'll use the GFS forecast from Tropical tidbits for 0000 UTC 20 November (5 PM MST Tuesday) to illustrate this incredible bomb cyclone. 

Source: TropicalTidbits.com

We're fortunate that storm is a bit offshore as it means the worst of the winds will be a maritime issue (but still a threat that will alter shipping routes).  However, the atmospheric river accompanying the system has its sights set on northern California and it appears it will be a long-lived AR event as we discussed in the prior post.  Below is the forecast for 1800 UTC 20 Nov (11 AM MST Wednesday).  The lower-left hand panel shows the magnitude of the integrated vapor transport (IVT) as colorfill and IVT vectors.  IVT is a measure of the amount of water vapor passing over a square meter of the earth's surface every second.  High values, indicative of an atmospheric river, extend from the eastern Pacific into northern California.  

Going out another 24 hours, there isn't much change in location, although the intensity is higher.  


Below is the Utah Snow Ensemble Forecast for Mt. Shasta Ski Park in the southern Cascades of northern California.  There is strong agreement in the ensembles for substantial precipitation at this location with the lowest amounts for this system (i.e., through 0000 UTC 24 November) of about 5" and the highest around 11" (see upper-left diagram).  I've used a red line to indicate an important transition point in the storm.  Prior to that time, the wet-bulb 0.5°C level is below the site elevation and the precipitation falls as snow.  In fact, there is a very tight clustering of the snowfall amounts through about 0900 UTC 21 November near about 25 inches.  Through that time, the wet-bulb 0.5C level in all the ensemble members rises (lower left panel) and the snow-to-liquid ratio falls (lower right) so this will be some high density, upside down snow. 

Around 0900 UTC 21 November, the wet-bulb 0.5°C level begins to rise above station elevation in somemembers and eventually it rises above station elevation inall members.  The net result is that all members call for rain in the latter part of this storm period.  Precipitation in the upper-left panel keeps increasing, but snowfall is flatlines and the snow-to-liquid ratio goes to zero.

The saddest five words in the English language are "the snow turned into rain." That looks to happen in this case.

Of course the more serious issues may involve flooding.  There is a flood watch issued for much of northwest California, including the northern and central Sacramento Valley, mountains of southwest Shasta County, and areas to the west. Let's hope the precip numbers for this event come in lower than advertised.