Thursday, August 31, 2017

Innovations to Help Our Air Quality Are Right in Front of Us

The lack of progress on improve the air quality along the Wasatch Front is deeply disturbing.  Excuses and foot dragging seem to be the modis operandi of the day.

Yesterday, the Salt Lake Tribune reported that many Utah business leaders sent a signed letter to Governor Herbert asking him to propose "bold strategies for addressing air pollution in Utah" and urging the Division of Air Quality "to propose a wide array of strong and ambitious proposals as part the Serious SIP it submits for public comment this fall."  The "Serious SIP" refers to the Strategic Implementation Plan for reducing air pollution in the Salt Lake Valley, as required by the EPA.  The full letter is included with the Tribune article, available here.

The article notes that Bryce Bird, director of the Utah Division of Air Quality, said that "truly innovative air quality solutions that hold promise for Utah are difficult to come by."

While I agree that there is no quick fix, the view that truly innovative air quality solutions are hard to come by is complete BS.  We have never had more opportunities to make choices that dramatically reduce local emissions, and the opportunities are growing.

We now have extremely efficient and effective battery powered lawn equipment including trimmers, leaf blowers, and battery powered lawnmowers.

I replaced my 22-year old gas-powered Craftsman lawnmower with a battery powered one this summer and what an improvement.  The battery powered lawnmower cuts better, is quieter, and doesn't belch out noxious fumes.

How about a batter powered snowblower?  I have one of these too.  It kicks ass.  No fumes and you don't have to tune it up each fall.


Over half of our emissions are mobile.  Yup, there's a solution for that too.  I don't have one of these yet (hanging on to my 14 year old minivan), but one's likely in the future.  


Plus, there are some old fashioned tools available.  These have been around for decades.


Migration from the internal combustion engine is entirely possible today, and it offers the most potential to improve air quality along the Wasatch Front.  Granted, 1.5 million people are not going to run out and buy an electric car tomorrow, and economic factors are a challenge for many in our community, but the argument that there are no truly innovative solutions is complete hogwash.  They are right in front of us.  We should be pursuing every possible avenue to stimulate and encourage migration toward electric vehicles (hybrids and plug-in hybrids also encouraged as a transitional technology).

Of course, electric devices and vehicles do produce emissions if the electricity source is a fossil-fuel power plant.  They also can produce emissions during the extraction of materials and manufacturing process.  However, those emissions are not local and concentrated in an urban area.  Transformation to low-carbon energy production is also essential, but a story for another day.

Wednesday, August 30, 2017

Beware of Sound Bite Harvey Attribution

Imagine the western U.S. equivalent of Hurricane/Tropical Storm Harvey.

Rain nearly nonstop in California for 6 weeks.  Runoff turning the Central Valley into an inland sea.  Sacramento buried under 10 feet of water.  Damages of more than a half-trillion dollars.

Now that would be a climate catastrophe right?

Except, it already happened.

During December.

In 1861.

Granted, the damages were not more than a half-trillion dollars.  That's merely the lower estimate of storm damage if it happened today.  But in December 1861, a megaflood in California killed thousands of people and 800,000 cattle.  A catastrophe by any standards, and it happened before significant global warming.


Source: USGS, Ingram (2013)
I write this to emphasize caution in interpreting the causes and contributors to the severity of floods produced by Harvey during and following the immediate aftermath of the storm.  The meteorology and hydrology of extreme events is mutlifaceted and highly complex and deserving of a more careful and cautious analysis.

Let's think back to the California Megaflood of 1861.  It it happened today, how would the press and public view it?  It would be unprecedented in "modern" (20th century or later) times and viewed as a disaster at least on par with Harvey. Paleoclimatic evidence suggests that such events have a "return interval" of 300 years, so we know such an exceptional event is possible when natural variability brings all the key ingredients together.  On the other hand, we expect global warming to serve as an amplifier of events of this type (see The Coming Megafloods).  In addition, we've changed the landscape of both the mountains and the Central Valley in ways that greatly affect hydrologic response.  So, will the next California megaflood be natural, caused by global warming, or caused by our land-surface modifications?  One can imagine all sorts of great clickbait headlines, but clearly, the causes are mutifaceted.

And, it is especially difficult to quantify the effects of global warming on a single event.  Global warming is having an effect on our weather and there are good reasons why we expect heavy precipitation events to increase in frequency and become more severe.  We should be concerned about this.

However, careful analysis is needed to truly understand the ingredients leading to the flooding produced by Harvey and the degree to which global warming has contributed to an increase in the likelihood of an event of such magnitude.  

Further, I am concerned about giving people a false impression that climate change is the only issue at play when it comes to our vulnerability of natural disasters.  Most scientists recognize this is the case, but the headlines command the attention of the public.

Andrew, Katrina, Harvey, and other tropical cyclones serve as reminders of our incredible vulnerability to natural disasters.  Paraphrasing Will Durant, "Civilization exists by meteorological consent, subject to change without notice."

In addition, we aren't prepared for the climate of the 20th century, let alone the one coming in the 21st century.  As a society, we are not only exposed to extreme weather events associated with heavy precipitation, but we're essentially doubling down on that exposure through ongoing, concentrated development and poor land-use practices and planning in vulnerable areas.

If we are to build a more weather and climate resilient nation, we need to recognize the multifaceted nature of the challenge.  Harvey serves as a wakeup call (unfortunately, we've had them before) and is not the last jaw dropping weather disaster we will face.

Tuesday, August 29, 2017

Misery Continues

Houston and the surrounding area are absolutely snake bit.  Tropical Storm Harvey now sits over the Gulf of Mexico just south of Galveston.  Although the precipitation area has broken up some, Houston and environs remain in one of the main shields.


It's been absolutely unbelievable how that area has been a magnet to precipitation for this event.  Such a shame.

It ain't over yet.  We all want this thing to be over, but Harvey will continue to float around SE Texas and western Louisiana through tomorrow.  The National Weather Service is calling for 2-3 inches today and another 2-3 inches tomorrow for the Houston area.  These numbers are lower than seen earlier this week, but are going to slow the recovery.  Let's hope that the stronger bands and precipitation regions spare the area.

Perhaps I'll write more later, but right now I've reached a point of numbness.

Monday, August 28, 2017

Where Will Harvey Go?

Now Tropical Storm Harvey now holds the record for the longest time remaining a named storm (i.e., with at least tropical-storm-force winds) after landfall in Texas.   At present, it is having a significant impact not only on Texas, but also southwest Louisiana, where the brunt of Harvey's randbands are currently moving onshore.  


Harvey is currently moving slowly southeastward and back over water.  It is expected to remain offshore through Tuesday, before making another landfall, somewhere along the northeast Texas Gulf Coast.  Although some strengthening is possible, Harvey is not expected to regain hurricane status prior to landfall.  


Nevertheless, it really isn't the wind, but the precipitation and flooding, that is the main issue with Harvey, and unfortunately he's going to continue to be a problem for Texas and Louisiana for the next few days (and longer in terms of recovery). 

Beyond that, Harvey is expected to move slowly up the lower Mississippi River basin, although the cone of uncertainty for the probable storm track is quite broad.  

Now, let me annoy mobile users with a very large loop, and perhaps violate all of my principles about extended range forecasts, by showing a GFS 10-day forecast loop (click to enlarge).  In this particular forecast, the upper-level trough spawned by Harvey is caught up in the circulation of the western ridge and, remarkably, slides eastward across the US-Mexico border, eventually reaching Baja and Southern California. 


Of course, if that were to happen, the main impact of Harvey would likely be to contribute to an increase in monsoon convection and precipitation.    

It's an interesting forecast, but it needs to be noted that Harvey is moving into an area of strong deformation where potential tracks are likely to "bifurcate" into two routes, one similar to the one above, another moving eastward.  Plus, there's always great uncertainty at such time ranges.  So, at present, I share this simply as a curiosity.  

Plus, I can note that the next 10 days, other than a brief system brush by later this week, Utah will be dominated by ridging.  Maybe some monsoon moisture can sneak in here or we get a thunderstorm for cooling, but for the most part, it looks like our hot summer weather will continue into early September.  

Sunday, August 27, 2017

Flooding "Beyond Anything Experienced"

There is no historical analog for the impacts of Hurricane Harvey.  The precipitation numbers being pumped out by our forecast models a couple of days ago were jaw dropping and beyond comprehension.  Unfortunately, those forecasts are coming to fruition.  

The numbers on the map below are 24-hour precipitation totals from the Texas Mesonet that I believe are since 7 AM CDT yesterday.  A significant swath of the area from northeast of San Antonio through the Houston area received more than 6 inches of precipitation.  Multiple stations in the Houston area reported more than 10 inches of rain, with a maximum of 18.02".  

Source: Texas Mesonet
Major flooding is occurring along streams and rivers across the region.  

Source: NWS
The National Weather Service Houston/Galveston forecast office has a graphic showing points that are forecast to reach major or record flooding stages, emphasizing that the impacts are "unknown and beyond anything experienced." 

Source: NWS
Humans like analogs as they help us put things into context, but that's not possible with this storm.  This morning I thought of the California Megaflood of 1861 (see http://wasatchweatherweenies.blogspot.com/2017/02/california-megafloods.html) as I surveyed data from Texas, as it affected such a large swath of the Central Valley, however, the meteorology and hydrology of California are drastically different from Texas, as well as the type and intensity of development there in 1861 compared to Texas in 2017.  

Ultimately, we're left with the reality that we are hurtling into unknown territory, with millions affected.  

Saturday, August 26, 2017

Harvey Landfall and Continued Deluge

Last night I kept an eye on the radar and surface observations in Texas as Harvey made landfall.  The image below shows the situation at 0135 UTC when the eye was just beginning to move over the barrier islands.


At that time, it was clear that Corpus Christi would be spared the worst of the winds.  Although they still had a miserable night, the eyewall, indicated above by the ring of high (yellow) radar reflectivity, where the strongest winds are concentrated, would pass just to their northeast.

Additionally, the right side of the eyewall was moving over Matagorda Island State Park and the Aransas National Wildlife Refuge, areas that are relatively undeveloped.


However, it was also clear that Rockport was spending a remarkably long time in the slow-moving eyewall.  I have never been through a hurricane, but colleagues who have spent time on the ground in or near the eyewall describe it as a terrifying experience.  The minutes must have ticked by like hours for those who remained in Rockport.

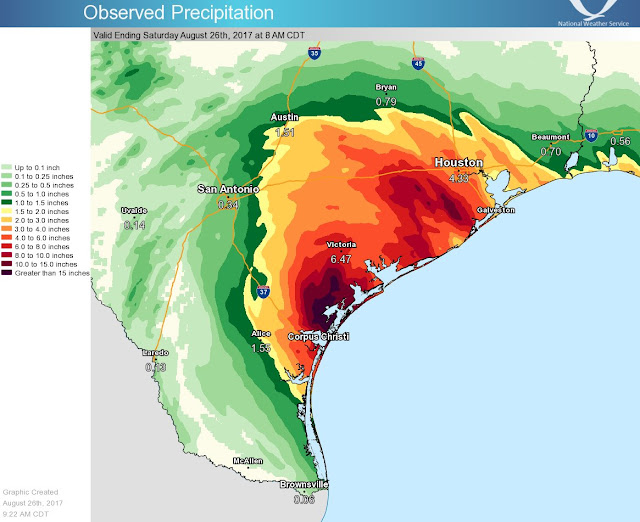
Harvey has been downgraded to a tropical storm, but while the winds have weakened, the flood threat is growing.  Water is the agent that delivers many hurricane/tropical cyclone impacts and the worst is far from over.   The National Weather Service rainfall analysis shows widespread accumulations in excess of 2 inches from near Corpus Christi to Houston, with more than 10 inches locally between Corpus Christi and Victoria, with the latter measuring 6.47."

Source: National Weather Service
Unfortunately, this thing is just getting started and Harvey is a slow-moving, moisture-processing system.  The NWS Weather Prediction Center rainfall forecast for 7 AM CDT this morning (Saturday) to 7 AM CDT next Saturday calls for 15-30 inches along the central Texas Gulf Coast with local accumulations of 40".

Source: National Weather Service
Information on streamflow and flood stages along rivers and streams in south Texas is available at https://water.weather.gov/ahps2/index.php?wfo=crp. One river forecast to reach a record stage is the San Bernard River.  Remember, this is a forecast, and much will depend on the amount and rate of rainfall in the drainage area for that river.

Source: National Weather Service
It's going to be a very long week in Texas.

Meanwhile, here in Utah, I was surprised to get sprinkled on this morning on my hike up Baldy and Hidden Peak.  A brief rainbow appeared, clearly indicating that there's a pot of gold in Snowbird village.  Must be Octoberfest...

Friday, August 25, 2017

Looking at Harvey

This is a blog focused on mountain weather, but sometimes our attention does wander, today to Hurricane Harvey and its impacts on the Gulf Coast.

First a little context.  It has been 4323 days since the last major (category 3 or higher) hurricane landfall on the Gulf or East Coast of the US.  This is by far the longest major hurricane "drought" since the mid 1800s.  It has been a good run, but one that may be ending today or tomorrow.

Hurricane Harvey is currently lurking off the Texas Gulf Coast.  Some perspective on the scale and significance of the storm is provided by a continental US sateltite and radar perspective.  Precipitation associated with Harvey essentially spans the entire Texas Gulf Coast, with associated cirrus clouds covering a broader region that is, well, approximately the size of Texas.


Zooming in, one can see Harvey's eye quite well, with a classic spiraling rainband pattern.


The latest advisory issued by the National Hurricane Center at 7 AM CDT (6 AM MDT) this morning reports that Harvey has maximum sustained winds of about 110 mph.  Doppler velocity imagery, which maps the wind speed toward (i.e., "inbound", cool colors) and away (i.e., "outbound", warm colors) from the Corpus Christi radar site, shows a clear "couplet" of inbound and outbound velocity associated with the hurricane circulation (due to the slope of the radar beam, these winds are sampled above the surface).


Note that the scale of that couplet is relatively small compared to the coverage of clouds and precipitation.  The strongest winds are confined to near the eyewall and the coverage of hurricane force winds is much smaller than the cloud and precipitation region.  From a wind perspective, life near that eyewall is far more terrifying than in the tropical storm force wind area farther from the low center.

Currently, Harvey is moving northwestward at 10 mph, but is expected to slow and strengthen prior to landfall.   The National Hurricane Center issues a "cone" of uncertainty meant to illustrate the probable path of the low center.  I put the cone in quotes because the remarkably slow movement of Harvey basically leads to a circle of uncertainty due to the unclear storm track from days 2-3 (solid white) and 4-5 (stippled).


Water is the agent that is responsible for the majority of hurricane deaths and damage.  Hurricane categories are based on maximum sustained winds, not the severity of storm surge or flooding.  The winds are certainly a concern for Harvey, but the potential for storm surge and flooding damage is very serious regardless of Harvey's category at landfall.  In the case of rain-related flooding, current forecasts from the Weather Prediction Center call for more than 15 inches of rain across a significant portion of the central Gulf Coast of Texas from 1200 UTC Today (Friday) through 1200 UTC Monday, with a maximum of nearly 25 inches.

As much as 35 inches is expected through Wednesday, which is expected to cause "devastating and life-threatening flooding."

And, just to add insult to injury, the Storm Prediction Center convective outlook includes a possibility of tornadoes and locally damaging winds today and tonight northeast of the Harvey low center.

The bottom line is that this is a very serious storm and a significant threat to anyone near the Texas (and possibly Louisiana) Gulf Coast.  It also represents a significant stress test for individual, local, state, and federal emergency management and response given the long major hurricane drought in this region.  I am hoping that the storm surge, precipitation, and flooding are not as bad as anticipated.

Thursday, August 24, 2017

Will This Be the Hottest Summer on Record?

With 8 days left to go in meteorological summer (June to August) this summer is in a dead heat with 2013 for the hottest summer on record at the Salt Lake City International Airport with an average temperature of 80.8ĀŗF.

Source: NOAA Regional Climate Centers
This summer had a pretty good lead through early August, thanks to all of the pain and suffering from late June through most of July, but we've given some of that lead back this month.  Granted, August hasn't seemed to bad, but it's still above average for temperature.  Everything is relative.

Forecasts call for a high-amplitude ridge to build in over the weekend and dominate our weather over the next several days.  This mean highs in the mid 90s beginning tomorrow and lows near 70 at the airport (give or take a few degrees).


The average temperature for the entire summer in 2013 was 80.8ĀŗF, which is right where we are at so far this summer.  Basically, we need to close out the last 8 days of August with an average temperature above 80.8ĀŗF to bust the record.  Much will probably depend on the minimum temperatures.  It's going to be close, but I rate the odds as better than not that we eke this one out.

Let's hope we do.  We suffered a lot this summer.  I want bragging rights.

Tuesday, August 22, 2017

Weak Monsoon Surge Today

A tip of the hat to the astronomers for getting yesterday's forecast right.  It was a great day for science.  Much thanks from the weather guessers.

And, speaking of the weather, keep your fingers crossed that we see some hydrometeors today.  We have a weak monsoon surge pushing in from the south, with moisture on the increase.  The NAM analysis and forecast loop below shows cloud cover and precipitable water values on the increase overnight and today for northern Utah.


The HRRR forecast for later today shows scattered showers and thunderstorms across northern Utah and Nevada.


The chaotic nature of atmospheric convection prevents us from precisely predicting the location and intensity of those showers, but let's hope they deliver.  A bit of rain later today and evening would be greatly welcomed.

Monday, August 21, 2017

Scenes from the Eclipse

Note: Post has been updated to correct location of site with 10ĀŗF temperature fall.

Before.

Source: CIRA
 After.
Source: CIRA
Incoming solar radiation (Salt Lake area sites).

Source: Alex Jacques, MesoWest, University of Utah
Temperature (Salt Lake area sites).

Source: Alex Jacques, MesoWest, University of Utah
Temperature at Peters Sinks (notorious cold spot in Bear River Range) site in the Bear River Range.  Fall of about 10ĀŗF, although it's unclear if we're at the bottom yet (probably close).

Source: Utah State University, MesoWest

Morning Eclipse Nowcast

Morning has broken and things are looking good along the path of totality over the western U.S.  It's early for a visible loop, but as can be seen below, a band of mid and upper-level clouds is slowly but surely exiting the totality path area of far western Wyoming and Idaho.  


Here's a look at the GOES-16 geocolor imagery from CIRA at 13:32 UTC (7:32 AM) and it looks pretty good too.  There are some thin patchy clouds over portions of the Idaho panhandle and western Montana moving southward that are just barely discernible in the imagery.   

Source: CIRA
You couldn't ask for a better forecast from the operational HRRR than the one below, valid about a half hour after totality.  No clouds predicted along the entire track from Wyoming to the Pacific Coast. 

Source: ESRL
That forecast might be a bit optimistic as there may be a few high clouds around over Idaho and the remnants of the cloud band evident that is over southern Idaho and western Wyoming this morning could linger near and along the totality track over central Wyoming, as indicated by the NAM forecast below.  


Nevertheless, conditions look quite good for the totality track from Jackson to the Willamette Valley with just the threat of some thin clouds spilling down from the north.  You can see these clouds, for example, in the Montana Snowbowl web cam image below.  


Good viewing to those of you along the path.

Addendum @ 8:25 AM MDT

Now that the sun is a little higher, visible satellite imagery shows quite a bit of smoke in the valleys of the central Idaho Mountains.


Based on web cams, I don't think this smoke will obscure the sun, although it may redden it.  Hopefully it won't spoil any views.  

Sunday, August 20, 2017

Eclipse Forecast Update at T-1 Day

"Eclipse viewing is about synoptic possibilities, 
but succeeding or failing based on unresolved cloud processes" 
Slight paraphrasing of quote about storm chasing from meteorologist Chuck Doswell

Model forecasts have trended in the "right" direction since our post on outlooks for the eclipse on Friday.  At that time, the models, such as the NAM below, alled for a short-wave trough to be over Idaho at eclipse time, with at least partial cloud cover over portions of Idaho and Wyoming.


As I write this, the latest (0600 UTC) NAM forecast calls for that short-wave trough to be both further east and weaker, with the Pacific coast ridge also shifted further east.  Much of Oregon is still in a prime spot for lack of cloud cover, but the situation, at least synoptically, is better for Idaho and the Jackson area than one would have anticipated from the forecasts on Friday.


If we look at time-height sections, however, there remains one concern to give me a little heartburn, and that is a sliver of upper-level moisture coming through around the time of the eclipse, as evident in both the Sun Valley and Jackson time-height sections.  Note, in particular, the area of higher relative humidity air in both sections [note that time increases to the left and that the eclipse occurs just prior (to the right) of 18Z Mon].


Because of that sliver, one can't rule out the possibility of some high clouds being around.  The odds are low, but non-zero, an perhaps higher in Jackson than the central Idaho mountains.

There's also some smoke around, as evident in satellite imagery from 13:55 UTC this morning. 

Source: CIRA
The webcam from Stanley looks pretty good this morning, however, so perhaps it is not dense enough to be a concern.  


By and large, the synoptic odds for eclipse viewing look good.  The primary issue now is whether or not unresolved cloud processes throw a low probability monkey wrench over your location at the time of the eclipse.    

Friday, August 18, 2017

Forecast Outlooks and Products for Eclipse Planning

As I write this, we are now about 3 days from the 2017 Eclipse and the ultimate test of transportation and communications infrastructure in rural areas of Idaho and Wyoming, where the vast majority of Utahns and University of Utah students hope to view the eclipse (Question: Will anybody attend class on the first day of the semester, which is also Monday?).

The large-scale forecast for Monday seems to be stabilizing, but I still consider highly specific cloud forecasts to be difficult given the weak large-scale forcing.  A high-amplitude ridge parked over our area would be a godsend for forecasters, but that's not what we're looking at for Monday.

Instead, the GFS calls for a weak upper-level shortwave trough to sweep across Idaho and Wyoming from 1200–1800 UTC (0600–1200 MDT), and be accompanied by some mid- and high-level clouds.  A short-wave ridge further west builds along the Pacific Northwest coast.


Eclipse time is approximately 1721 UTC (1121 MDT) in Redmond, OR, 1730 UTC (1130 MDT) in Stanley, ID, 1736 UTC (1136 MDT in Jackson, WY, and 1741 UTC (1141 MDT) in Riverton WY.  That's just before the bottom image above, which given the GFS forecast would yield the lowest cloud cover odds and fractions during the eclipse over eastern Oregon and increasing cloud cover odds and fractions as one moves eastward to western Wyoming.  

The NAM agrees with the basic synopsis being advertised by the GFS, but note that the shortwave trough orientation is more from SW to NE (positively tilted in meteorological vernacular, and that the structure and characteristics of the clouds varies when one examines the gory details.  


That variation in the structure and characteristics of the clouds represents the dilemma for forecasts along the path of totality over Idaho and Wyoming.  This is a weak shortwave trough, so a routine "public" forecast would be pretty straightforward.  Probably mostly sunny given the fact that some mid and high level clouds aren't going to be a big deal.  

However, exactly where and when clouds will be at the time of eclipse is difficult to ascertain.  Will one have a clear view of the sun in Jackson, but have an untimely patch in Driggs?  Impossible to say.  In part, this reflects the unpredictability of such cloud cover at such long lead times, but also the fact that present day forecast models do not explicitly resolve cloud processes, adding to the forecast uncertainty.  Timing will also matter.  For example, if you just happen to be underneath a local area of clouds at the time of eclipse, that's a bummer.  

Based on current forecasts, the greatest likelihood of clear skies over the interior mountain west eclipse path is eastern Oregon.  The potential for some mid or high clouds exists as one moves eastward, especially over eastern Idaho and Wyoming.  The timing, location, and extensiveness of that cloud cover remains uncertain.  

For your planning purposes, here are a few products for your consideration:

1. NWS Digital Forecasts. You'll need to use the drop-down menu to request "Sky Cover (%)" and select the appropriate time.  12 PM is the closest available.  One disadvantage of these forecasts is that they are "deterministic" and don't show the full range of possibilities.  Numbers represent percent of cloud cover.  

Source: NWS
2. Experimental High Resolution Rapid Refresh (HRRRX). HRRRX is an experimental version of the HRRR that is being developed and tested by the NOAA Earth Systems Research Laboratory for future operational implementation.  Forecasts are available out to varying lead times (probably dependent on computer time availability), including cloud products.  At 3-km grid spacing, this is the model to go to for short-range cloud-cover guidance.  In addition, they have added sun-obscuration mods to account for reductions in solar radiation during the eclipse (details here).  I've been told that a more "crash proof" web access to the HRRRX is available here.

Keep in mind that even at short time scales, errors in cloud cover are to be expected.  Use the HRRRX (and other model forecasts) as guidance, but not absolute truth.

3. GOES-16 Imagery.  I'm a huge fan of these high-frequency, geocolor loops from CIRA.  Use for "eclipse chasing" the morning of the event and fine tuning during the event, if traffic permits.

Hopefully, the forecast verifies with minimal clouds and not an unfortunate veil of thick cirrus.  Good luck!