Sunday, January 19, 2025

Snowbird Magic

In the previous post (Real Winter), I commented that the storm for Friday Night and Saturday was "a crap shoot situation given the limited moisture" and that "much will depend on instability, lake influences, and, for Little Cottonwood Canyon which might have the best chance of something, maybe some Alta magic."

In hindsight, I really didn't have any idea how complicated and productive the storm was going to be and that it was really "Snowbird Magic" that we were going to get.  

What Actually Happened

Automated data from Alta-Collins showed that at upper-elevations in Collins Gulch (9962 ft), about 11 inches fell with only 0.5" of water, yielding a 22:1 snow to liquid ratio or 4.5% water content. In other words, very low density snow, even if the use of gauge water equivalent measurements, which often don't catch all the snowfall, might result in a low estimate of water content.  However, remarkable contrasts of snowfall occurred in Little Cottonwood and Alta was not the big winner.  

As noted in the Utah Avalanche Center report "some areas of Upper Little Cottonwood received 20.5 inches of snow (0.97 inches of water)." That 20.5 inches appears to be from Snowbird, which reported a 48-hour total of 20 inches on their mountain report this morning. I wasn't skiing yesterday, but from what I've heard, snowfall appeared to increase with decreasing elevation at the Little Cottonwood resorts, with perhaps the base of Snowbird serving as the snow capital of Utah for a day.  

How Could This Happen?

I can only put forth some hypotheses that might be worthy of greater investigation.  These are based in part of my analysis of the event and other storms that have done some oddball things like produce more snow on the east bench than in upper Little Cottonwood Canyon. These are sometimes called "upside down storms" because snowfall decreases with elevation (see Classic "Upside Down" Storm), not to be confused with upside down snowfall in which higher density snow sits on top of low density snow. 

First, let's establish the time period that the snow fell.  To do this I'm going to use data from Alta-Collins since I don't have access to observations from the Snowbird Base.  Measurable water-equivalent precipitation was recorded at Alta-Collins in all but two hours from 0600 UTC 18 January (11 PM MST Friday) to 0100 UTC 19 January (6 PM Saturday). The break was from 1800 to 2000 UTC (11 AM to 1 PM Saturday).  Water-equivalent rates were unimpressive throughout this event and less than or equal to 0.07" for the entire period and automated measurements suggested that at no time did snowfall rates exceed 1" an hour.  This doesn't mean that there couldn't have been some short bursts (less than an hour) that were heavy, but they never produced more than an inch increase in interval-board snow at this location.


Snowbird, however, had nearly double the snowfall.  Peak hourly water equivalent and snowfall rates there were certainly higher. 

Large-Scale Environment

The large-scale environment in which that snow fell featured the passage of an upper-level trough in large-scale north-northwesterly flow.  This was a cold system and somewhat moisture starved compared to troughs that approach us from the west or northwest (even at Snowbird where snowfall was heaviest, the low-density nature of the snowfall in this event was certainly an inch or less).  Below is the GFS analysis for 1200 UTC 18 Jan (5 AM MST Saturday) showing the trough just upstream of northern Utah.  

The sounding from the Salt Lake City Airport at 1200 UTC 18 January (5 AM MST Saturday) is below.  This is upstream and not necessarily representative of what was going on in Little Cottonwood at that or other times, but there are some things that capture my attention. First, the atmosphere below 700-mb (roughly 10,000 ft) was consistent with the shallow convective clouds that I observed during the event.  It was well mixed at low levels with the dewpoint depression (the difference between the temperature and dewpoint decreasing with height to an apparent shallow cloud layer between 750 and 700 mb (for whatever reason, the NWS soundings rarely show the same dewpoint and temperature even in cloudy air). I've identified this layer with a purple box.  
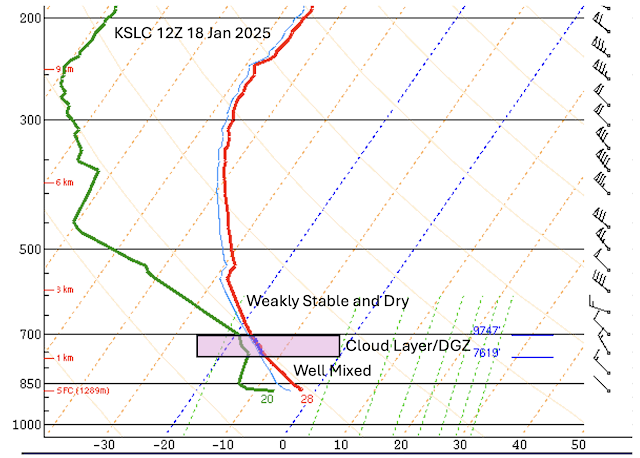
That layer also had temperatures between -12 and -18C, or what is called the dendritic growth zone or DGZ.  Those are the temperatures that given suitable relative humidities, favor the development of dendritic snow crystals (the six armed beauties that we have all come to know and love).  Given the low-density snow in this event, I'd expect a lot of snow growth in this layer.  

Above the apparent snow layer, the dewpoint and temperature diverge again with height.  In addition, that layer is weakly stable, which would make it difficult for convective clouds to penetrate to higher altitudes.  

So, this one sounding suggests this was a shallow system and that the layer for dendritic growth was confined to below 700 mb or 10,000 feet.  

Radar Analysis

Finally, we have the radar.  There are a lot of problems using radar to estimate precipitation in a situation like this.  First the beam is partially blocked by the topography, and the influence of that blockage varies depending on location.  Second, this is a very shallow storm, so the storm clouds may only partially fill the beam.  Finally, this was lower density snow, which is notoriously problematic for radar precipitation estimates.  With those caveats in mind, below is the estimated water equivalent precipitation for the 24-hour period ending at 0300 UTC 19 January (8 PM Saturday).  The highest amounts are on the Cottonwood ridge (green squares indicate 0.5 to 0.75" of water) from about Mt. Superior westward. Amounts decrease as one moves eastward and northeastward from Mt. Superior into upper Big Cottonwood Canyon. 


That estimate is roughly consistent with what I observed on radar during the storm which was that echoes tended to be stronger and more frequent not in the highest reaches of Little Cottonwood, but west of Alta. Because of terrain blockage, however, the radar cannot tell us much about the local snowfall variations within the canyon itself, especially near the canyon floor and the base of Snowbird.   

An Initial Hypothesis

My best guess of what was happening in this event is as follows.  It was a shallow storm in flow that was generally from the northwest (on Hidden Peak and Mt. Baldy the flow was WNW or NW for the entire storm period).  The latter is consistent with enhancement in Little Cottonwood, but the shallow nature of the cloud layer and the weakly stable and dry nature of the airmass above crest level may have limited storm penetration into the interior of the central Wasatch and certainly into the lee.  This, or maybe just dumb luck, led to greater precipitation frequency and intensity west of Alta. 

In addition, this was a cold storm.  Temperatures on Hidden Peak and Mt. Baldy were at or below -18C for most of the storm period.  As a result, the dendritic growth zone was below crest level, potentially resulting in greater crystal growth within the canyon volume (i.e., below the ridge tops), leading to greater accumulations not at the highest elevations, but instead at mid elevations.  

There could be other factors at play.  Feel free to share your observations of snowfall or your ideas for mechanisms in the comments.  

Summary

What a storm!  Snowbird Magic 1, Alta Magic 0.

Friday, January 17, 2025

Real Winter

The GFS 500-mb forecast for 1800 UTC 19 January (1100 MST Sunday) is one that should put a smile on the face of anyone who misses "real winter."  An incredibly deep and broad trough, centered near Hudson Bay, covers most of North America.  

As a result, the 5-day average forecast surface temperature anomalies, or the departure from average, centered on that period is negative (or below average) across much of the United States and Canada, with a bull's-eye near the border of North Dakota and Saskatchewan.  

Source: tropicaltidbits.com

It's nice to know that Mother Nature can bring it still from time to time.  

It will be getting cold in Utah, but really we are going to miss out on the coldest of the air thanks to protection from the Continental Divide.  Forecasts from the National Weather Service National Blend of Models for KSLC show maximum temperatures dropping from 39-43F today to the low 30s tomorrow and then possibly into the 27-32F range on Monday.  Minimums eventually get down to the low to mid teens on Monday night.  


Winter, but not brutally so.  For perspective, the average high/low for this time of year is 39/24 (based on 1991-2020 observations).  

There are a couple of short-wave troughs that drop down the back side of the long-wave trough during this period, but they are pretty moisture starved.  Probably the best shot for mountain snow is from late today through tomorrow morning.  The GFS forecast valid 1500 UTC 18 January (0800 MST Saturday) shows the trough right over northern Utah with some precipitation over the mountains.  

This is a crap shoot situation given the limited moisture.  Much will depend on instability, lake influences, and, for Little Cottonwood Canyon which might have the best chance of something, maybe some Alta magic.  There isn't much model agreement for snowfall through noon tomorrow.  The 12Z HRRR is pretty much a nothing burger (.06" water with 1" of snow).  The GFS is a bit more enthused (0.35" water with 6" of snow).  Most of the Utah Snow Ensemble members are between .22 and .47" of water and 3.5-8" of snow.  

You may be able to tell from those numbers that what we get is likely to be of the low-density variety where it isn't trashed by the wind.  Temperatures tomorrow morning are going to be frigid, with our forecast for Mt. Baldy (11,000 ft) of -4F and Alta-Collins (9600 ft) of 2F.  

Keep your boots and toes warm.

Tuesday, January 14, 2025

Mainly Quiet on the Western Front

The current snowdepth at Alta Collins sits at 83" after peaking at 92" on Saturday.

Some people have asked me about the prospects of a Steenburgh Winter this year, that period from when Alta-Collins first reaches 100 inches to February 10th when the mid day sun angle and day length start to really increase and have an increasingly caustic influence on snow, first on south aspects and eventually as we go deeper into spring on all aspects.  Steenburgh winter is the creme-de-la-creme of backcountry ski conditions with a deep snowpack to enable good coverage across a lot of terrain and low-angle sun for powder preservation.

The potential for the start of Steenburgh winter looks quite low for the next ten days.  Ridging is in firm control currently along the Pacific coast this morning.

That ridge meanders a bit, but remains in place really for the next 10 days or so.  About all we can hope for is a trough to slide down its front side and drop into our area.  Unfortunately, such systems are often fairly moisture starved.  Below is an example from the GFS forecast valid 5 PM MST Sunday. 

The Utah snow ensemble thus has just a couple of weak systems coming through such as the one above, with some variations in intensity and timing between the ensemble members.  There's always the hope that one of those systems gives us a decent dump of low-density dendrites, but 75% of the members are producing less than 6" of snow over the next 10 days.  

Thus, I'll call it mainly quiet on the western front, with the hopes that we at least get a little bit of a refresh with the passage of one of these moisture starved systems.  Sometimes a bit of moisture and instability does the job in Little Cottonwood, so maybe we'll get lucky, but the start of Steenburgh winter looks unlikely during this period.  

Thursday, January 9, 2025

A Banner Season in Japan

There's so much bad news on the weather front in the US due to the wildfire catastrophe in SoCal, that I thought I would talk about something more uplifting: The remarkable snow season that they are having in Japan.  

I like to say that if Utah has the Greatest Snow on Earth, but Japan has the Greatest Snow Climate on Earth.  Really, there is nothing like Japan's "Gosetsu Chitai" or heavy snow region near the Sea of Japan.  It is the snowiest, densely populated region on Earth with Sapporo the snowiest city in the world with a population of more than 1 million and Sukayu Onsen in the Hakkoda Mountains in northern Honshu the snowiest inhabited place on Earth.  The numbers below are based on 1981-2010 climate normals.

There are three things that make Japan's Gosetsu Chitai so special for snow.  First, it lies downstream of Eurasia, the world's biggest continent, which results in frequent and prolonged cold-air outbreaks over the Sea of Japan during the East Asian Winter Monsoon.  Second, the Sea of Japan is an enormous body of water, 12 times bigger than Lake Superior, the largest of the North American Great Lakes.  The Tsushima Current that flows through the Korea Strait also ensures a steady supply of warm water along the Japanese coast during the winter.  Third, the sea-effect precipitation systems that form over the Sea of Japan (basically the equivalent of lake-effect snow) run into the formidable topography of Honshu and Hokkaido Islands.  

Utahn's are rightfully proud of the snowfall in Little Cottonwood Canyon, but it is worth comparing the numbers from the Town of Alta to Sukayu Onsen.  Not only is the seasonal snowfall more plentiful at Sukayu Onsen, but after a slow start in October and November, it also comes much faster, especially during the peak of the East Asian Winter Monsoon from December to February.  Basically, climatology is a 3-month pig wallow with an average of more than 140" in each of those months, peaking at 180" in January, more than double the Town of Alta.  

This year the snow in has come fast and furious, with skiasia.com reporting remarkable snow depths last month.  Current snow depths in central Honshu include 169 cm/67" at Shirakawa (478 m/1568 ft elevation), 150 cm/59" at Tsunan (452 m/1483 ft), 163 cm/64" at Oisawa (440 m/1444 ft), and 188 cm/74" at Hijiori (330 m/1083 ft).  All of these sites are south of 38.6ÂșN and at relatively low elevation.

Source: JMA

Given that the Japanese Meteorological Agency (JMA) does not have any high elevation observing sites in central Honshu, I took a look at the snow report for Hakuba Cortina Ski Resort in the northern Hakuba Valley near the Sea of Japan (location on map below).  It is reporting at current snow depth of 340 cm/134 inches.  Event that is probably an observation from below 1400 m/4593 ft as the resort is on the lower slopes of the Hida Mountains.  

Source: Google Maps

A look at the map above for central Honshu illustrates the remarkable transition in snow climate across Japan.  At low elevations near the coast, snow depths are < 35 cm/14".  These areas are actually quite wet during the East Asian Winter Monsoon, but they experience more precipitation in the form of rain.  Going inland and up in elevation and you get into much deeper snowpacks, even at the lower (< 1600 ft) observing sites operated by JMA.  Go across the mountains to the east side of Honshu and there is no snowpack at lower elevations.  

In northern Honshu and southwest Hokkaido, Sukayu Onsen (890 m/2920 ft) is at 380 cm/150", which is down from their peak at over 400 cm.  Kutchan (176 m/577 ft), which is near the base of the Niseko United Resorts, is at 147 cm/58".  

Source: JMA

Media reports suggested that Kutchan was at record snow depths at times in December.  I suspect that's not the case currently, but cannot confirm this.  Regardless, it is an impressive start to the Japanese snow season.  

Sunday, January 5, 2025

About Yesterday's Snow Bomb

Impressive snow totals and snowfall rates occurred yesterday in Little Cottonwood Canyon.  The big winner was Alta.  As readers of this blog are well aware, the Alta Ski Patrol maintains a great snow-study plot in the upper elevations of Collins Gulch.  The hourly measurements from this site are a treasure trove to meteorologists like me who are starved for observations from higher-altitude locations.  The "snow interval" data below is collected by an ultrasonic snow-depth sensor that is mounted on a pole above a white snowboard that is wiped every 12-hours.  It recorded 20" of snow over and 11 hour period prior to being wiped just after 1600 MST.  


Really, the 20" mark was attained in only 9 hours, from 0400 to 1300 MST, yielding a mean snowfall rate of more than 2 inches and hour for that period, with a peak snowfall rate of 5 inches from 0600 to 0700 MST.  Due to roundoff of the measurement, there is a little uncertainty in that estimate, but it's safe to say it was snowing very hard at that time.  A bit more snow fell 1300 MST, but its rate of accumulation was roughly balanced by new-snow settlement, so the final tally remained 20 inches.  

Observations from Mt. Baldy show that the first 6 inches fell as the flow switched from WSW to WNW and the temperature dropped about 4F from 0400 to 0600 MST.  That indicates a frontal passage, but even during this period, there wasn't a strongly organized frontal band, although there were scattered showers and clear evidence of orographic modulation of the precipitation, meaning related to flow interaction with the topography.  Radar imagery at 0425 MST (1125 UTC) when snow was picking up at Alta showed strong modulation of radar echoes by the Oquirrhs and the Wasatch with echoes strongest over and/or windward of those features and strong precipitation shadowing in their lees, including over the western Salt Lake Valley.  So, this was very much an orographic storm right from the beginning. 


During the period of heaviest snowfall from 0600 to 0700 MST, the flow on Mt. Baldy was WNW and radar coverage became more extensive.  Still, echoes were strongest over and windward of the Oquirrhs and Wasatch Range, including the northern and central Wasatch and weakest over the western Salt Lae Valley.  


Finally, by 0848 MST (1548 UTC), the influence of the Oquirrhs and central Wasatch remain apparent, but there is also an elongated band of higher reflectivity extending from the Great Salt Lake to the central Wasatch.  


We have done computer model simulations of similar storm periods in the past in which we were unable to reproduce such a precipitation pattern unless we included both the lake and the topography.  Below is an example from one northwesterly flow storm in which we ran with the best representation of the lake and terrain possible (CTL), removed the lake and the topography (FLAT-NL), removed only the topography (FLAT), included the lake and the Wasatch (WAS), included the lake and the downstream terrain but no upstream terrain (DT), and removed the lake (NL).  There's a lot to digest there, but if there's no topography, the event only produces some light downstream snowshowers.  If there is no lake, only light precipitation occurs over the higher terrain including the Oquirrhs and central Wasatch.  However, when you run with them both (CTL), you get a solid storm.  Thus, both lake- and terrain-driven processes contribute. 

Source: Alcott and Steenburgh (2013)

I suspect this may have been the case for this later stage of the storm yesterday, although that's just a hypothesis at this point.  Overall though, I see yesterdays storm as one that was strongly driven by flow interaction with topography, with perhaps some lake influences thrown in later in the event.  

A few more thoughts

Yesterday's storm was impressive for snowfall rate as measured by depth, but less of an outlier from a water-equivalent perspective.  The 20" of snow that fell had a water content around 5%.  During the period when 5" fell, only 0.15" of water equivalent was observed.  That would be around 3% (although that estimate may be a little low due to gauge undercatch of snowfall).  Peak 1-h water equivalent rates were around 0.17".  That's not bad, but it's also not exceptional.  If you are wondering, the highest 1-h water equivalent was 0.17".  That's not bad, but it's also not exceptional.  The record hourly water equivalent snowfall rate at Alta-Collins is 0.54", which occurred from 0300 to 0400 MST 5 Jan 2008 in southwesterly flow accompanying a "warm and juicy" atmospheric river event just ahead of an approaching trough.  

I share these observations to highlight to different ways that one might measure and evaluate extreme snow rates.  One is based on snowfall amount.  The other is based on water equivalent amount.  Yesterday's snowfall extreme occurred due to the high snow-to-liquid ratios (i.e., low water content).  From a water perspective, it all that impressive.  Storms that produce high water equivalent rates are often warmer, with lower snow-to-liquid ratios, yielding lower snowfall amount rates.  For these storms, my eyebrows pick up when we start approaching 0.3" per hour.  

Thus, much depends on the metric that you use, although none of these scientific semantics take away from what I hear was an outstanding day of skiing. 

Thursday, January 2, 2025

Yes, 2024 Was Warm

Final numbers will become available in a few days, but it is likely that 2024 will be the warmest year on record globally.  I'm not sure if the difference from 2023 will be statistically significant, but that doesn't really change the story of long-term warming.  

With an average temperature of 57.4F, it was also the warmest year on record in the Salt Lake City area based on observations collected by the National Weather Service, and by a pretty wide margin.

Source: https://xmacis.rcc-acis.org/

If fact, it beat the previous record holder, 2012, by 0.8F.  Given the inevitable grousing about the representativeness of the airport site, I'll also add that this was also the warmest year on record at the Bountiful Bench site, which has continuous records back to 1975.


That site observed an average temperature of 55.0F, topping the previous record holder, 2012, by 0.6F.  

Precipitation for the year at the airport was 14.78" which was just a skiff below normal (15.52").  Snowfall for the year was 26.2" which was about half of average (51.9").  I have not had a chance to carefully break that down to see if that was due to dry cool months or a greater fraction of cool-month precipitation falling as rain, but a quick look at the graphs suggests the latter dominated.  

As an anecdote, we have now made it roughly through my 2024/25 "snow blowing season", that period during which I normally blow out my south-facing driveway after storms since the sun is too low to melt it out in a short period of time.  I haven't run the snow blower once.  It's sitting in the garage collecting dust.  Nothing that has fallen on our driveway or sidewalk has survived for more than a few hours.