Wednesday, June 29, 2011

More Dust from Two Different Processes


There were two different dust events today. The first occurred around 1:45pm when a strong thunderstorm went through the valley. Winds gusted to 60mph at the airport and visibility dropped to 4km, but the event only lasted about 10 minutes. The airport did report blowing dust so this will go into the books as an official event.

The Radar during this time was quite impressive with dBzs greater than 50
Dust events associated with convective downdrafts are informally known as "Haboobs." They originate from local sources, do not last very long, and are quite common in Utah. The second event is going on now...


This dust is not associated with a thunderstorm but rather the strong pre-frontal southerly winds. Unfortunately the concentrations are too weak and it is too late in the day to determine where the dust is coming from. Frontal passage tonight should put an end to this dusty weather.

Dust Event Yesterday, post by Jeff


Dust became visible yesterday afternoon a little after 5pm in the salt lake valley and it stuck around for much of the evening. Here is an image from the Olympus cove weather cam

The event yesterday took place in the pre frontal environment of an approaching Intermountain Cyclone, which is very typical for spring time dust storms. The IDV analysis from 6pm yesterday clearly shows an area of low pressure over north-eastern Nevada riding along an anomalously strong pacific trough for this time of year.


One of the biggest issues Jim and I have faced researching Utah dust transport is determining when a dust event takes place. Dust observations require human input making them very subjective. Unfortunately yesterday was a perfect example of why you can not always rely on human observation. When the dust came through yesterday the visibility dropped to 4 miles, but KSLC reported haze even with a 10% relative humidity!

Dust detection from satellite can also be very tricky. Remote dust retrieval only works during the day and when there are no clouds present. MODIS has high resolution, but only passes over Utah once during the day. Yesterday the pass came around noon when there were only a few small plumes over the West Desert.
Luckily a more simplified dust retrieval algorithm can be applied to GOES data, which reports about every 15 minutes. At around 5pm the only real visible plume is over SW Nevada and UT is fairly quiet. The dust we saw here was either too weak or too late in the day to be picked up by the algorithm.


Monday, June 27, 2011

Rainier Dreams

 Mount Rainier (Photo courtesy Washington State DOT)
For mountaineers and meteorologists, no mountain in the contiguous United States compares with Mount Rainier.  It has it all: massive scale, great vertical relief, extensive glaciation, ecological diversity, and incredible weather variability.

Paradise Ranger Station on the south side of the mountain is one of the snowiest instrumented locations on Earth.  The National Park Service reports an average annual snowfall of 680".  As of 17 June, 907" of snow has fallen on Paradise since 1 July 2010, which sounds like a lot, until you realize that their all-time record is 1122", set during the 1971-72 winter.

Nevertheless, the SNOTEL snow-water equivalent for this year is quite impressive, peaking at just over 100" in mid May.  Remarkably, more than 80" remains today.  And this is at only 5120 feet!  Only slightly higher than Salt Lake.

Source: Northwest River Forecast Center
The deep snowpack is also evident in the National Park Service web cam, which looks east from the visitor center and captures a portion of the iconic Paradise Lodge.

Photo: National Park Service
Chinook Pass, located near the eastern boundary of the park, is also quite famous for prolific snowfalls and they had one bear of a time getting it open this spring.  Washington State DOT has posted some great photos here, but I've snagged a couple below for quick viewing.

Cayuse Pass 20 April 2011 (Photo: Washington State DOT)
Chinook Pass 1 June 2011 (Photo: Washington State DOT)
Mount Rainier does have a rainshadow, and less snow falls in the northwest corner of the park in the area around the Sunrise visitor center.  In the summer, this area is often sunny while the western lower slopes of Mount Rainier are draped in marine stratocumulus.  Nevertheless, getting the road and facilities at Sunrise open has proven quite difficult this year.  As shown in the photos below, rainshadow is a relative term.

Photos: National Park Service
And how about a quick stop at the restrooms?
Photos: National Park Service
Apparently the road to Sunrise will finally open this Friday.  Simply incredible.

Sunday, June 26, 2011

Thar She Goes!!!

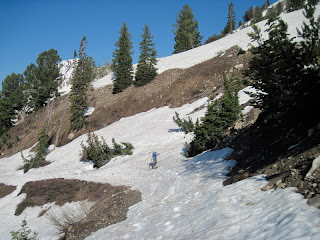
It is quite remarkable just how much snow has melted in the Wasatch over the past week.  After nearly 8 months of incredible skiing, the snowpack is finally looking and skiing "tired', especially on south facing aspects.

Grizzly Gulch, 9000 ft elevation, 26 June
Over the past three days, the Snowbird SNOTEL has lost almost 9 inches of SWE and is now down to just over 30 inches (its May peak was 75).  Thus, about half the snow at this site is gone.


Similarly, the Collins snow stake has dropped from 193 inches to 123".  Can we make July or perhaps the 4th with 100"?  I think the former is possible, but the latter is going to be close.


Roaring torrents of water are cascading down every canyon.  Little Cottonwood Creek is a "white ribbon of hell" pulverizing everything in sight.


Standing next to the creek, the ground literally shakes.  For a bit more perspective, click here for a video.     She can't take much more of this captain!

Despite the melt and increasingly tired snow, there's still good coverage above 8500 feet on aspects on the north side of the compass, for those of you who simply must make turns.

Devils Castle, Sugarloaf Peak, East Greeley, and Greeley Bowl
26 June 2011.  
And despite my view that the snow is tired, my son still thinks the skiing is great.  I couldn't help but share this photo of him cresting out today above Wolverine Cirque.  Great job kid!

Saturday, June 25, 2011

Wasatch Microclimates

It is quite remarkable how much the vegetation can change in just a couple hundred meters in the Wasatch Range.

Today I had a chance to experience the lush lowland oasis that is Ferguson Canyon, a minor canyon just south of Big Cottonwood Canyon.  Despite having lived in Salt Lake for more than 15 years, it was my first trip, but won't be my last!

The trail starts at 5000 feet on a west facing aspect.  The vegetation here is a mix of grass, wildflowers, and sage, which is unusually lush for late June given the historically wet spring we just experienced.


A short walk around the corner, however, and you enter an incredibly lush "jungle" along the stream that today was "raging" down Ferguson Canyon, which was pleasantly cool.


Several factors contribute to the microclimate in Ferguson Canyon.  Although the canyon faces roughly west, it has an abrupt steep ridge immediately to its south, which reduces the net solar radiation in the canyon. Then, the stream and high water table enable an abundance of plant life, so that a substantial fraction of the solar energy that is received is used for evapotranspiration rather than sensible heating of the atmosphere.  This also reduces the magnitude of the daily temperature range, so that temperature extremes are not as large.

You can find microclimates of this type throughout the Wasatch.  They contrast with what happens on exposed south-facing slopes, where the net solar radiation is maximized.  For example, on the south face of Wilson Peak, one can find sagebrush at altitudes of more than 9000 feet.  

But there is another remarkable microclimate that we experience every day, and that is the human-modified climate of the Salt Lake Valley.  From the viewpoint above Ferguson Canyon, once can easily see the "urban forest" that we have cultivated in the valley during the past 150 years.

Looking west from the viewpoint above Ferguson Canyon
Cities in the east have a lack of forest and an excess of concrete, asphalt, and impervious surfaces.  This leads to the well-known "urban heat island."  The situation in Salt Lake, however, is more complicated.  The natural vegetation before human settlement was grass.  Annual precipitation was 15-25 inches.  We replaced that natural vegetation with roads and buildings, but we have also imported water and plated trees, as is readily apparent in the photo above.  Irrigation in the Salt Lake Valley has a cooling effect that partially offsets other urban effects.  Beyond evapotranspiration, the effect of trees includes changes to the long- and short-wave radiation budget.  

To my knowledge, these issues have not been deeply explored so that we have a comprehensive knowledge of urban effects on climate in the Salt Lake Valley.   For example, to what degree does the "oasis effect" from urban irrigation offset warming imposed by other urban effects?  What is the impact of trees and how does that impact very seasonally?  These are questions that seem simple, but are actually quite difficult to answer.  

Friday, June 24, 2011

Tropical Cyclone Meari and Extratropical Mischief

As discussed in yesterday's post, I'm quite interested in looking at tropical-extratropical interactions during this monsoon season.  I'm also interested in how tropical cyclones impact weather prediction in the midlatitudes, and today we have an interesting case to examine.

Over the past two days, tropical cyclone Meari has tracked north-northwestward from the maritime sub-continent toward China and is presently located between Taiwan and Japan.


The Joint Typhoon Warning Center forecasts Meari to move northward, making landfall on the Korean Peninsula at around 1200 UTC 26 June.
Source: Joint Typhoon Warning Center
As tropical cyclones move northward and interact with the midlatitude flow, they can cause all sorts of mischief with regards to weather prediction.  In particular, they are often accompanied by heavy rainfall and related diabatic heating.  Sometimes they undergo extratropical transition and redevelop as a extratropical cyclone.  Both of these processes can contribute to the building of an upper-level ridge and can lead to a process called downstream development in which the flow downstream becomes highly amplified.  Since these processes are highly nonlinear, this often leads to large uncertainty in medium-range forecasts.

As shown in the GFS loop below,  Meari is not expected to undergo extratropical transition (at least during this 5 day period).  It weakens following landfall, but as can be seen in the dynamic tropopause analysis (top panel), it does contribute to the development of a high amplitude ridge over Japan.


There is, however, another cyclone in this case, an extratropical cyclone that develops over the northwest Pacific and moves into the Bering Sea.  Downstream of this feature a pronounced upper-level ridge forms over the Gulf of Alaska and contributes to a sharp trough that develops off the Pacific Northwest coast.

There is great uncertainty in regards to the position and intensity of this trough.  If we look at the GFS ensemble, one can see wide ranging solutions.  In some, the trough moves onshore as an open wave, in others it closes off upstream of California.  This makes quite a bit of difference in the weather for folks in the Pacific Northwest!

Source: Penn State Meteorology E-Wall
At issue is how much this forecast uncertainty results primarily from processes in the mid and high latitudes, such as the midlatitude cyclone development, or processes related to tropical cyclone Meari.  I suspect the former may be quite important, but Meari could be contributing as well.  We'll see events where tropical cyclones have an even stronger impact on our forecast in the coming months.

Thursday, June 23, 2011

The World in the Palm of My Hands


As some of you know, I am going on sabbatical for the next academic year.  Contrary to conventional wisdom, sabbatical is not a one-year vacation, but release time from teaching and committee service for the purposes of professional development.  I will be writing a book (stay tuned), working on a number of research projects, and continuing my never-ending quest to be able to access meteorological data and visualize and analyze the atmosphere at "the speed of thought" so that my classes are as dynamic and exciting as possible.

Along these lines, I've been using the Unidata IDV to hold the world in the palm of my hand and have a better look at tropical-extratropical interactions as we move into the monsoon season.


My goal here is to be able to click a button and have a multi-day loop that allows me to look at the basics of the weather anywhere in the world.  In the above image, you are looking at a global IR image with the dynamic tropopause pressure (color filled transparent so you can see the clouds underneath), precipitable water (contoured, warmer colors = higher values), and 925-mb wind vectors (a compromise level since surface winds often miss the core of moisture advection associated with low-level jets).    I can click on and off a few other fields as well, depending on the situation.  Very nice!

People often ask me why I prefer the dynamic tropopause over conventional pressure analyses.  The bottom line here is that cyclonic (and anticyclonic) disturbances in the upper atmosphere often are not located on the same pressure level, but typically are found on the dynamic tropopause.  I only need to look at one level to have a good understanding of the upper levels.   Further, one can easily trace extratropical PV anomalies as they drift into the tropics and cause mayhem.  There are other reasons related to PV dynamics, but we won't get into those here.  Ideally, I'd use PV potential temperature rather than pressure, but pressure is built into the IDV, so I'm using it for convenience.

For today, I'll share a zoomed in look of the North American sector, which shows quite nicely the decaying mid-latitude cyclone over the upper midwest and associated moisture transport from the Caribbean Sea and Gulf of Mexico northward into the Mississippi River Basin.


Looking forward to checking out the monsoon with this in the coming weeks.

Wednesday, June 22, 2011

The Big 90?

Update 1:29 PM: Blogger images are now working.  NAM figure added.

Remember that long wet, cool spring?  It's over.  Summer arrived yesterday and Mother Nature is turning up the heat.

By tomorrow, 700-mb temperatures over Salt Lake are forecast by the NAM model to hit +15C, which should give is a high of about 90.


The heat will give us a serious pulse of runoff, including in the Cottonwood Canyons.  Little Cottonwood, for example, is expected to approach flood stage tonight (Wednesday night) and peak tomorrow night.  

Tuesday, June 21, 2011

Subaru Weather Bashing

You have probably seen the Subaru ads featuring the "World's Worst Weatherman."  This brutal slam of our all-important profession has really ticked off some meteorologists.

I was rolling with it, but now they have really ticked me off.  They have an option on their web site to "see how much of your life you have wasted on the weather."


There are two things I find deeply offensive about this.  First, one cannot waste time on the weather.  As Ben Franklin said, "Some are weather-wise, some are otherwise." Fluctuations in mercury are infinitely more interesting than fluctuations in gold.  Time spent thinking about the weather cannot be deducted from a persons life.

Second, and this is the real insult, when you click on the drop down menu to select the time spent checking the weather each day, the maximum option is ONLY THREE HOURS!!!

Are you kidding me?

Having owned a Subaru previously, me-thinks they need to start thinking more about head gaskets, struts, transmissions, and CV-joints than the weather.  We have our part covered.

Monday, June 20, 2011

The June Climate Transition

June is typically an important transition month over southwestern North America.  It is during this month that an upper-level anticyclone develops and builds westward from over the Gulf Coast to northern Mexico, enabling relatively dry, large-scale westerly and southwesterly flow to be replaced by comparatively moist easterly and southeasterly flow over much Mexico.  This can be seen in the 10-year climatology of 500-mb height below.

Mean pentad (5-day averages) 500-mb height for 1979-88.
Source: Adams and Comrie (1997)
This circulation change is characteristic of the so-called North American Monsoon, and it leads to a pronounced warm-season peak in precipitation across much of Mexico and portions of the American SouthWest (especially southeast Arizona and New Mexico).

Seven-day mean 500-mb analyses for the first part of June show evidence of this large-scale circulation change this year.  In particular, note below the development and intensification of locally high 500-mb heights over northern Mexico, especially during the past week.


People often talk about the monsoon here in Utah, but I've never considered Utah to be part of the monsoon region.  Instead, we are in what I like to call the monsoon "surge" region, meaning that we are north of the primary monsoon region, but can get surges of monsoon moisture and precipitation into our area.

Anyone care to bet what sort of monsoon "surge" season we will have this year?

Sunday, June 19, 2011

Father's Day Lake- and Playa-Effect?

Mother Nature will not give us a break.  A well-advertised dousing is underway this morning as yet another upper-level trough moves through northern Utah.  The NAM-model analysis for 1200 UTC (0600 MST) this morning shows the uper-level trough axis just upstream of northern Utah with 700-mb temperatures of 1C over Salt Lake and less than 0C just upstream.


The latest regional radar shows that the heaviest precipitation is falling over and downstream of the Great Salt Lake and over and downstream of the Salt Flats to the west.

Source: NCAR/RAL
More frequent and intense convection over these two areas is quite evident in the KMTX radar loop from 1237–1453 UTC.


Is this simply a reflection of the larger-scale environment, or are the lake surface and salt playa contributing through locally enhanced surface heat and moisture fluxes?  

In the case of the Great Salt Lake, the latest MODIS derived lake-surface temperatures from yesterday were quite balmy and in the 18-22C range.  It certainly seems plausible that the lake is juicing things today.


In the case of the Salt Flats, playa has a very large thermal inertia compared to the surrounding land surface.  In other words, its temperature changes more slowly.  Further, it can sometimes be covered, especially in a year like this, with a thin lens of water, which would be quite warm due to yesterday's warm temperatures.  These two factors could be contributing to locally high heat and moisture fluxes over the Salt Flats.

So, perhaps we have lake- and playa-effect (or at least enhancement) occurring today.  

Saturday, June 18, 2011

Snirty snow

I went for a tour today in White Pine and Gad Valley and was quite disappointed to see just how "snirty" the snow has become in the past week.  All of the dust and impurities from the past winter are slowly but surely collecting on the snowpack.

The "snirty" snowpack was quite evident while looking at
the White Ribbon of Cruising where Snowbird groomed
Regulator Johnson
The snowpack is especially gross at mid elevations,
such as here in Gad Valley
If you know a good wax for this, give me a call
Snirt means part SNow part dIRT.  Because dirty snow absorbs more solar radiation than clean snow, it results in a faster snowmelt.  We'll talk about this more in a future post.  Right now I need to get these stinky socks off and take a nap.

Friday, June 17, 2011

Does a Bigger Great Salt Lake Mean More Lake Effect?

A recent article in the Salt Lake Tribune mentions that the Great Salt Lake is expected to rise as much as 5.7 feet thanks to this spring's runoff, which would be a one-year record.  It also suggests this may help the lake generate more lake effect snowstorms.

Conventional wisdom is that a bigger lake leads to more lake-effect, but this assumes that the "weather" doesn't change.  In other words, that the frequency and characteristics of cool-season trough passages remains the same.  In reality, there are huge fluctuations in the frequency and characteristics of cool-season trough passages fro year to year.

We will be unveiling some new research soon that shows that lake-effect is better correlated with the "weather" of a given winter rather than the lake size.  I'm hoping we'll see more lake-effect next winter, but I won't be counting on it.  If we have a ridge-dominated winter, a big lake makes little difference.

April Showers Bring May Showers Bring June Showers...

It's no surprise to anyone who lives in Salt Lake that this has been an incredibly cool and wet spring.  I just took a look at the climate data for May and it is impressive.

For Utah as a whole, May was the 8th coldest in the 117 year period examined by the National Climatic Data Center.
Source: NOAA/NCDC
And the 2nd wettest.
Source: NOAA/NCDC
As shown in the analysis below, May was characterized by anomalous 500-mb troughing over the entire northwest United States.

Source: NOAA/ESRL
Persistent troughing over the northwest in May was reflective of a pattern that has dominated the entire spring (Mar–Apr–May), as shown in the 90-day 500-mb height anomaly analysis for the period from 4 Mar – 1 Jun.  Note the scale change, which makes the anomalies seem a bit more ominous than those above.

Source: NOAA/ESRL
And the troughs just keep coming.  The latest NAM puts a deep upper-level trough over Idaho by 1800 UTC (1200 MST) Sunday.  With 700-mb temperatures falling to near 0C, there will be cool rain in the Salt Lake Valley and snow in the Wasatch above 9500 feet yet again.