
Let's begin with data from the two new fixed sites. The first is at the Neil Armstrong Academy in West Valley City (G thumbnail below) and the second is out our mountain meteorology lab near the mouth of Red Butte Canyon on the University of Utah campus (H thumbnail).
 |
| Source: ACME Mapper |

.png)
At Neil Armstrong Academy, however, PM2.5 is consistently higher than at our mountain meteorology lab, and the overnight minimum is more elevated. This illustrates the importance of location, location, location when it comes to air pollution exposure. The Neil Armstrong Academy is at only 4260 feet and well removed from the canyons that issue from either the Oquirrh or Wasatch Mountains. It is deep within the valley cold pool and well removed from any sources of cleaner air. In contrast, our mountain meteorology lab is at 4996 feet, which for the current inversion is near the top of the pollution, and it sits at the mouth of a canyon from which clean air can sometimes flow overnight. As a result, at least for this event, PM2.5 levels have been lower on the upper University of Utah campus than found along the valley floor, especially at night (NOTE: This is not necessarily the case for all inversion events as their depth and characteristics can vary).
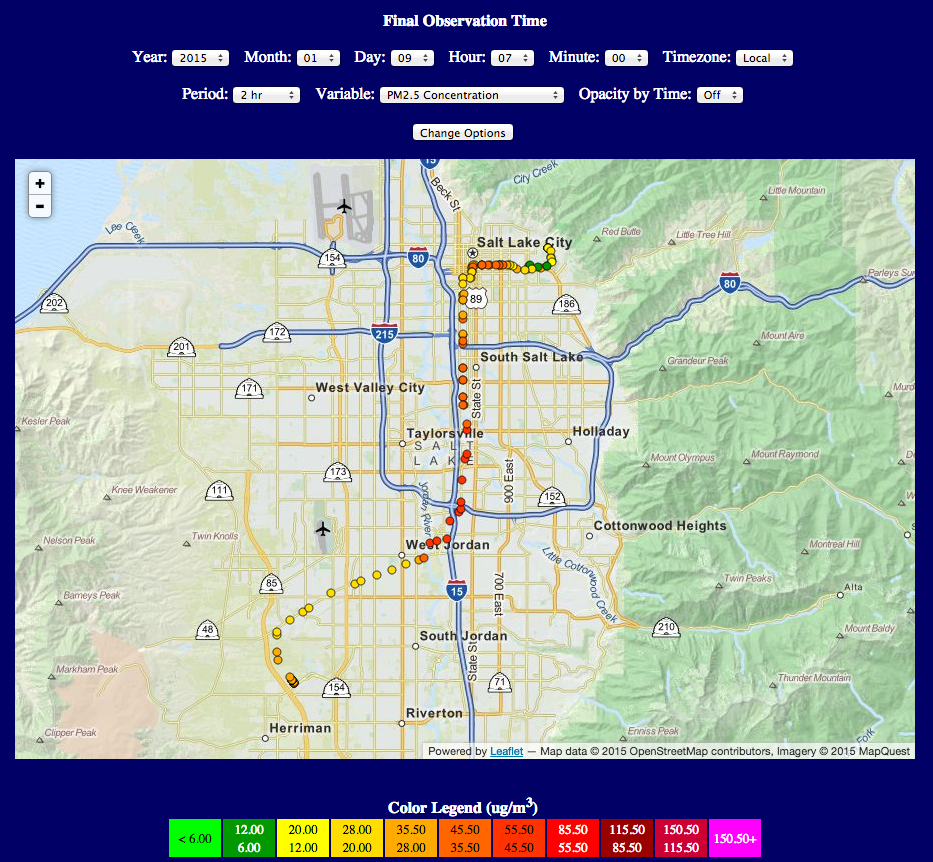
Further insights can be obtained from observations collected by the Trax mounted sensor. Data along the red line collected during the 2 hours ending 5 PM yesterday shows consistently high values (>55 ug/m3) from West Jordan to the University of Utah campus with a peak of 89 ug/m3. Folks, this is some seriously crappy air, qualifying as "unhealthy." In the southwest valley, some lower PM2.5 concentrations were found near the end of the line in the Daybreak area.
 |
| Source: http://meso1.chpc.utah.edu/mesotrax |
Contrast that with the run this morning when PM2.5 values are lower everywhere, but there is also more spatial variability. The highest values are found along the valley floor from West Jordan to roughly I-80 where they are generally > 35 ug/m3 with a peak of 53 ug/m3. Lower values are found elsewhere, including some remarkably low values (< 12 ug/m3) near and just west of the University of Utah campus where I suspect there has been an incursion of cleaner air from one of the canyons.
 |
| Source: http://meso1.chpc.utah.edu/mesotrax |
One of my favorite sayings is "all generalizations are wrong" and so I caution against generalizing these observations as applying to all inversion periods. Much depends on the characteristics of the inversion, it's strength, depth, the presence of upper level clouds or snow cover, and other effects. The characteristics of this event, for example, might change as fog becomes more widespread and prevalent or as there are other meteorological changes. Nevertheless, it's great to see more comprehensive real-time PM2.5 observations rolling in, although I'd be even happier to see clean air.
Seems to be very complicated physics driving mechanisms for spatial and temporal variations in particulate matter concentrations. I wonder if a large contributing factor to decreased concentrations during night time is due to entrainment of cleaner air from along the down slope of the benches driven by radiational cooling in the benches above the inversion? Closer to the lake, perhaps there is turbulence associated with a land breeze during the night that causes more mixing with air over the lake? This is very interesting stuff.
ReplyDeleteIt looks to me that the dirty air mass is staying put and getting worse with time, as shown by the increase in the peak with time. During the night colder, cleaner air filters downslope and replaces the dirty air at the sensor sites. Perhaps, simply pushing the dirty air up above the sensors. When day heating occurs the cooler air at the surface warms and the dirty air "falls" back to sensor level. Can those sondes record PM2.5 data with elevation?
ReplyDeleteSondes = Soundings - weather baloons - whatever they are called.
Delete@ 1520 the TRAX sensors are 20 point higher than Hawthorne, and squarely in the red. This second opinion is nice to have.
ReplyDeleteThe TRAX sensors are not as high quality or as well calibrated as those maintained by DAQ, so some of the difference could be from these factors. Nevertheless, it's pretty safe to say the air is quite crappy.
DeleteWhere is the PM 2.5 coming from? Is it mainly cars traveling on the I-15 as seen on the second TRAX map?
ReplyDeleteWhat are the sources of PM2.5?
Deletehttp://home.chpc.utah.edu/~whiteman/PM2.5/PM2.5.html#sources
Can you share links to the data from the two new samplers?
ReplyDeleteUniversity of Utah (near Red Butte Garden): http://mesowest.utah.edu/cgi-bin/droman/meso_base.cgi?stn=mtmet. Click on "new graphical display" and select PM2.5 for variable to graph.
DeleteNeil Armstrong Academy: http://mesowest.utah.edu/cgi-bin/droman/meso_base.cgi?stn=NAA
strava heatmap overlay
ReplyDeletehttps://www.facebook.com/photo.php?fbid=10100260659817713&l=52c37a54f1
almost makes me wonder if a physically active culture (walking/cycling/etc) could have a causal inverse relation with pollution. full disclosure I live among those green dots, as do many of my car-free/car-light friends. Data from the blue line would be interesting, Corner Canyon is one of the hottest spots on the map.
sorry link fail, strava heatmap overlay
Delete