Monday, November 11, 2024

Déjà Vu All Over Again

I had a mild bike ride to the office this morning for November 11 and the forecast high for this afternoon is 65 for KSLC. 

Tomorrow will be different. 

However, it is a bit of a case of déjà vu all over again as it is a system that reminds me of the others we have had so far this fall with the strongest part of the trough and the so called "dynamics" moving to our south.  We get a frontal passage and some precipitation, but looking at the models, the system is just not put together great to give us a really big dump. 

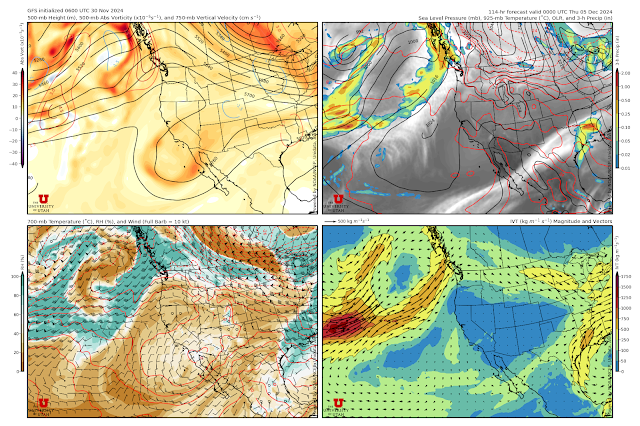
Below is the GFS forecast valid 1200 UTC 12 November (6 AM MST Tuesday).  The strongest part of the 500-mb trough is basically over Northern Arizona and southern Utah and passing to our south.  The surface front is pretty much over Salt Lake City, but the 700-mb temperature contrast with it is somewhat diffuse and the precipitation with the front scattered and not all that organized.  

The GFS time height section shows very dry air ahead of the front and then a period of about 6-hours with deep moisture as the front moves through.  We do get into northwesterly post-frontal flow Tuesday night, but it is fairly dry at low levels (below 800-mb).  This is not the kind of forecast that causes my heart to flutter. 


The latest models are calling for a small storm at Alta.  Through late Tuesday the HRRR generates 0.25" of water and 3.5" of snow and the GFS  0.37" of water and 5" of snow.  The experimental RRFS has a remarkable amount of spread with one member producing essentially a trace and another up at 10".  

I'm not sure what to make of that, but I view that 10" as something close to the upper limit of what I'd expect under the best of circumstances, with a significant boost from lake-effect interactions with the terrain behind the trough.  

Finally, the Utah Snow Ensemble is generally in the under 12" range with means from the two ensemble systems at about 4" and 6".  Yes, I know there's more snow after this system in this forecast but I'm not going to address that here.  Whatever you do, don't be biased by the highest members! (See Anchoring Bias and Ensembles for why). 


It is what it is, another modest system that will add a bit more to our November snowpack.  I'm thinking 5-10" for Alta Collins. Although it is clear that the ensembles are saying the range of possible outcomes for this event is pretty big, there isn't much here to get me thinking about more than a foot.  That said, none of these models are particularly good at dealing with the post-frontal northwesterly orographic snowfall enhancement in the Cottonwoods.  Then again, they also aren't advertising a great environment for that.  

Saturday, November 9, 2024

Colorado and (gasp!) Texas Running Away With It

 Looking for snow?  Forget the Collins glacier.  Go to Alta or maybe Texas.  

Over the last four days, Colorado, New Mexico, far western Oklahoma, and the upper northwest corner of Teas were absolutely pounded.  This includes the high planes.  Texline, TX recorded 24" of snow.  Boise City, OK, not Idaho, recorded 26".  


The big winner was a site 12.9 miles ENE of Fort Garland with 53.3".  The NWS does not provide specific locations for privacy reasons, but that looks to be a site in the low pass through the Sangre de Cristo between the San Luis Valley and the I-25 Corridor.  Some big numbers as well in the high plains of Colorado and the mountains of New Mexico.  A look at Angel Fire (40") this morning.

https://www.angelfireresort.com/weather/

I've always wanted to ski there just for the name.  One of the best in the business. 

The fattest snowpacks in the Utahrado region are now in the San Juans and Sangre De Cristo Mountains. The big winner (blueish dot) is Beartown at 11,600 feet which is sitting at 7.7 inches.  This is the equivalent of their median snowpack on December 20th, so they are running about 6 weeks ahead of median. 

Source: NRCS

Hayden Pass in the Sangre De Cristos now sits at 5.8 inches, the equivalent of their median on December 28 and way above anything on record, although observations at this site start only in 2008.  


There are, however, other sites at record levels for this date in the Sangre de Cristos, Pikes Peak, and Buffalo Peaks.  These are historically dry areas, so an extreme event like this is really exceptional. 

It's a weak La Nina year and this has guided seasonal forecasts.  Here's one for Nov-Jan from the Climate Prediction Center that now looks on track to bust for at least parts of southern Colorado and northern New Mexico.  


This one event has produced about 2/3 of the average Nov-Jan precipitation showing how an extreme weather event can strongly contribute to seasonal precipitation and snowfall.  This is a characteristic of the cool-season snow climate of some regions of the western United States that is often overlooked when seasonal forecasts are being issued.  It introduces an element of randomness to the year-to-year variability in western precipitation that can limit the reliability of seasonal forecasts based on long-term means and similar analyses.  There is a good paper by Lute and Abatzoglou (2014) showing that 20-38% of the annual snowfall water equivalent and about 2/3 of the year-to-year variability in that metric can be attributed to the top ten decile (10% largest) snowfall events in portions of the western United States.  Basically, a handful of big events, sometimes just one or two, make or break the season.

Congratulations to the early season snowfall winners.  

Tuesday, November 5, 2024

The RRFS Snow Ensemble

We are excited to share that the RRFS Snow Ensemble is now available on https://weather.utah.edu and has replaced the old SREF product.

The RRFS Ensemble is a 6-member ensemble that is under development for future operational use by the National Weather Service.  Based on the FV3 dynamical core (i.e., the software that solves the atmospheric equations of motion), it is run at 3-km grid spacing and provides forecasts out to 60 hours.  The RRFS Ensemble is projected to go operational in 2024, although there have been a number of issues and challenges identified during testing that may affect that, in particular related to the forecasting of convective storms in the midwest.  The RRFS Ensemble has not been carefully evaluated over the western US, so one of the reasons we are producing this product is to evaluate its fidelity for orographic precipitation.  

We are also interested in testing our techniques for snow prediction.  Thus, what we call the RRFS-Snow Ensemble is basically an ensemble in which we plug in new techniques to predict snow-to-liquid ratio (SLR) and snow amount.  A summary of the data and methods and graphics is provided below. 

Precipitation Downscaling

Although we downscale the Utah Snow Ensemble from the lower resolution global ensemble grids, the RRFS is providing forecasts at 3-km grid spacing. Thus, we are currently doing no precipitation downscaling and just using the raw model grids.  There might be some advantage to downscaling the RRFS eventually, but for now, we're not doing it.  

Snow-to-Liquid Ratio (SLR)

Snow-to-liquid ratio (SLR) is based on a new random forest algorithm developed using SLR observations from more than 900 Community Collaborative Rain, Hail & Snow Network (CoCoRaHS) observing sites.  Thank you to all the volunteer observers and the CoCoRaHS team!  In particular we are using a subset of CoCoRaHS observing sites at which the observers are taking manual cores of the snowfall data, which we hope will reduce issues related to precipitation undercatch, which is a problem with the water equivalent measured by many gauges.  The random forest is trained using data from across the contiguous United States and in testing has performed better than existing operational techniques in both the western and eastern United States.  

Snow Level

Identifying snow level in the west or precipitation type in the east is a bit of a thorny issue.  The so-called "wet-bulb" technique that we use in the western United States works fairly well when the temperature decrease with height is close to what meteorologists call a wet-adiabatic lapse rate.  It doesn't work well if the atmosphere is stable and/or has a warm nose above freezing aloft.  

As a result, we decided to use a more physics-based approach to identify if snow is occurring.  At each model grid point, we calculate the melting energy in the model soundings.  This is the amount of energy available to melt snow in the sounding.  The technique is based on Bourgouin (2000), although we use wet-bulb temperature rather than dry-bulb temperature to calculate melting energy (special thanks to Kevin Birk of the National Weather Service for providing some of the initial code for this work).  Currently we are applying our random forest SLR without adjustment if the melting energy is ≤ 2 J/kg and assuming the precipitation is all rain if the melting energy is ≥ 9 J/kg.  If the melting energy is between those values, we reduce the SLR between the random forest value and 0 based on linear interpolation between the two thresholds.  

Those thresholds are based on published values, but admittedly, the data is not comprehensive.  It may require some modification over time.  However, they do give results similar to the wet-bulb method when the lapse rate is near moist adiabatic and can deal with more complicated temperature profiles.

Note that we are not attempting here to diagnose freezing rain or sleet.  The melting energy approach we are using will basically give us a SLR of 0 in those instances.  So, our plots only show forecasts of accumulated snow.  

We are working with another group to possibly incorporate a machine learning technique for precipitation type in the future, but it may be a while before we get to that.  

Four-Panel Plots

We provide loops of four-panel plots of the following variables for several regions, including over the central and eastern US: 

  • Total precipitation (water equivalent) since the beginning of the forecast period
  • Total snow since the beginning of the forecast period
  • 24-h precipitation (water equivalent)
  • 24-h snow
  • 6-h precipitation (water equivalent)
  • 6-h snow
  • 1-h precipitation (water equivalent)
  • 1-h snow
  • Wet-bulb 0.5°C height above ground level (based on the lowest wet-bulb 0.5°C level)
  • SLR

SLR and snowfall are calculated in 1-h intervals, with the resulting 1-h accumulations summed to provide accumulations over longer periods.  Thus, the 24- and total snowfall should not be confused with the change in snow depth on the ground over long time periods, which would be affected by settlement.  

Each four panel plot includes the the RRFS control forecast at upper left, the ensemble mean at upper right, the ensemble minimum at lower left, and the ensemble maximum at lower right.  Below is an example of the total snowfall through 60-h over the Wasatch Front.


For some of the caveats of interpreting these plots, see my blog post on The Utah Snow Ensemble

Plume Plots

We are also providing forecast plumes and violin plots for many locations, including several in the northeast US, to provide more information about SLR uncertainty.  These are identical to those for the Utah Snow Ensemble, so refer to The Utah Snow Ensemble blog post for information on interpreting these plots.  The RRFS ensemble, however, only has 6 members, so there are not a lot of forecasts and the violins are going to be based in part on interpolation fro sparse data.  Some groups use time-lagging (i.e, using older forecasts) to increase the ensemble members (but also decreasing the forecast period), but we're not bothering with that for now. Perhaps at some point we will change the lower left panel from wet-bulb 0.5 level to melting energy, but for now we're keeping it consistent with the Utah Snow Ensemble.  The wet-bulb 0.5°C level is based on the lowest level in the sounding, so it will not tell you where the top of a warm nose is and may not be a useful variable in situations where there is a warm nose aloft.  


Caveats and Disclaimers

This is an experimental product.  In fact, it is an experimental SLR product post-processing experimental ensemble modeling system!  Feedback is helpful to us as we are trying to find ways to better forecast snow and its characteristics and squeeze everything we can out of the operational model suite.  Tell us what works and what doesn't.  

The RRFS ensemble is based on data and products from the National Centers for Environmental Prediction (NCEP), University of Utah, and other groups.  These groups do not accept any liability whatsoever for any error or omission in the data and their availability, or for any loss or damage arising from their use. 

This blog post may be updated as needed.

Sunday, November 3, 2024

The Oquirrhs Got the Snow

If you are looking for snow, perhaps you should look to the west to the Oquirrh Range instead to the Cottonwoods. The latest snow water equivalents from SNOTEL sites show the highest amounts at the three SNOTEl stations in the Oquirrhs.  These numbers do not include the lake-effect snow that fell out there last night and this morning.   

Source: NRCS

Shall we have a closer look?  The fattest snowpack is at Rocky Basin Settlement (8704 ft) where the snow water equivalent sits at 2.7". 

That's well above median for that site, although median so early in the season isn't a very robust statistic.  

For comparison, the Snowbird SNOTEL (9177 ft) is at only 1.2 inches.


Why are the Oquirrhs so blessed?  A big chunk of the snowpack at Rocky Basin Settlement fell on October 29.  They got some snow in the southwest flow like the Cottonwoods, but they did very well in the north-northwesterly flow following trough passage.  For example, the radar image below for 1821 UTC 29 October shows strong echoes just to the west of the Oquirrh crest.  These echoes persisted for a good chunk of the afternoon. 


It's hard to say exactly what the role of the lake was during that period, but the echoes are suggestive that both lake-effect and orographic (mountain lifting) processes contributed to snow enhancement over the Oquirrhs.

Then, in the evening, some lake-effect snow developed. 


For a while, as midnight approached, a very localized band developed.  


So, the Oquirrhs have done much better in the post-trough north-northwesterly flow than the Cottonwoods.  

Is this unusual?  It depends on what you use as a baseline.  It is unusual for the Oquirrhs to have more snow than the Cottonwoods.  At Rocky Basin Settlement, peak median snow water equivalent is 23.9 inches compared to 42.9 inches at the Snowbird Snotel. 

On the other hand, lake-effect periods produce about the same amount of snow in the Oquirrhs as in the Cottonwoods.  The figure below shows the water-equivalent produced by lake-effect periods during the 1998-2009 water years (adapted from Yeager et al. 2013).  During those water years, lake-effect periods produced an average of 2.12 and 2.37 inches of precipitation water equivalent at the Rocky Basin Settlement and Dry Fork SNOTEL stations in the Oquirrhs, respectively, compared to 2.06" and 2.38" at the Mill D North and Snowbird SNOTEL stations in the Wastach, respectively (see left figure below).  


However, since the Oquirrhs are otherwise drier, lake-effect periods constitute a greater fraction of the cool-season precipitation there (right figure above), including 6.3% and 8.4% of the cool-season precipitation at the Rocky Basin Settlement and Dry Fork Snotels.  For comparison, lake-effect periods produce 5.9% and 5.1% of the cool-season precipitation at Mill D North and Snowbird.  

So, such lake-effect snow is not unusual in the Oquirrhs.  They are currently ahead of the Cottonwoods because they were favored given the north-northwesterly flow in the wake of the trough on 29 November.  A similar situation occurred last night and this morning.  

As the saying goes, it's better to be lucky than good.  

Friday, November 1, 2024

Another Digging Trough

 It's déjà vu all over again if you are a meteorologist with another digging trough (or if you prefer "splitting") forecast to move across the western US this weekend.

The last one gave us 8" at Alta-Collins, with another inch yesterday.  The current snow depth sitting at 8".  I don't think they've bothered firing up the guns yet so the base remains scant even on the Mamba-Corkscrew trails.  

The GFS forecasts the 700-mb trough to be right over Salt Lake City at 0600 UTC (0000 MDT) Sunday.  As I mentioned the trough is a digger and a splitter, so a the strongest "dynamics" or large-scale rising motion, is to our south over Arizona (the red contour indicates large-scale rising motion of 1.5 cm/s).   


Although not a direct hit, the models are generating precipitation over northern Utah as the front moves through (see upper-right panel above) and then a period of cold northwesterly flow on Sunday as the trough moves downstream (see below).  


Total water equivalent and snowfall generated by the GFS through 11 PM MDT Sunday at Alta-Collins are 0.99" and 14.3", respectively.  A look at the Utah Snow Ensemble shows that 06Z 4 Nov (just an hour later as the ensemble forecasts are only processed every 6 hours), the ENS Mean is about 0.6"/9" and GEFS mean about 0.8"/12".  

This reminds me a good deal of the last storm in that it is not all that well put together, but there is some potential if the band with the trough and the post-frontal northwesterlies come through.  I'm once again thinking something in the 8-14" range, although if I were a wagering man, I might say the odds of going more than that are bit greater than less than that.  This is also indicated by the plume diagrams above which show a lot of clustering between 8 and 12" of snow and then about 10 members that er in the 15-21" range by 06Z 4 Nov.   

There is some potential for another storm midweek next week.