
Below is a graph showing the snowpack snow water equivalent at the Mill-D North Snotel in Big Cottonwood Canyon during this past winter (green), the average winter (blue), and the exceptional 2010/11 winter (red). During the 2010/11 winter, we not only had a huge snowpack, but after a gradual draw down in May, the melt rate in June was stupendous and averaged about 1.67" per day. If you want a big melt rate, it helps to have a healthy snowpack survive until deep into the warm season when the the sun angle, temperature, and day length are maximized.

In contrast, this year was characterized not only by a below average snowpack, but also a very gradual melt rate. The decline in snowpack from a peak of 14.6 inches on March 10th to near zero on April 23rd represents an average melt rate of only 0.33" per day. Warm springs lead to a more gradual snowmelt due to the more modest sun angle, temperature, and day length.
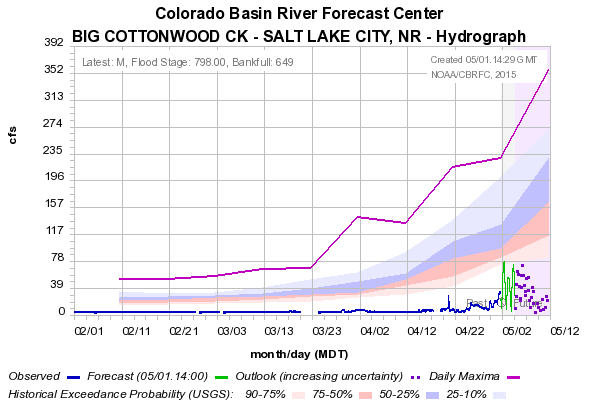
Little wonder why this year we've seen barely a trickle coming out of the Cottonwood Canyons. That pathetic blue line in the charge below is the observed runoff at the mouth of Big Cottonwood Canyon. The transition from pink to blue represents the median.
No comments:
Post a Comment